AEC industy is currently producing an enormous amount of data that project managers may struggle to understand. The data collected in BIM models are worthless if we cannot understand and utilize it properly.
Data visualization can aid us in this endeavor.
A few weeks ago, I organized a live webinar titled “Automation and Data Visualization on a $1.1B Project.” My guest was Nicolas Døssland, a BIM Specialist from C3BIM company.
Nicolas demonstrated how to leverage the power of data using PowerBI to make it more accessible and understandable for the rest of the project team.
Do you want to see RECORDING from this webinar and get special GIFTS for FREE?
Just sign up in the form below, and I will send you the mail with a link to the webinar recording and…
Automation Script - how to use Solibri Autorun to perform automation of a few repetitive tasks
Presentation- that I am going tu use during the session
Subscribe to our list and download Practical Guide to start with BIM Coordination. Interactive BIM Coordination guide full of tips, graphs, mind maps, and practical exercises.
It will teach you the basics of BIM Coordination. All for free.
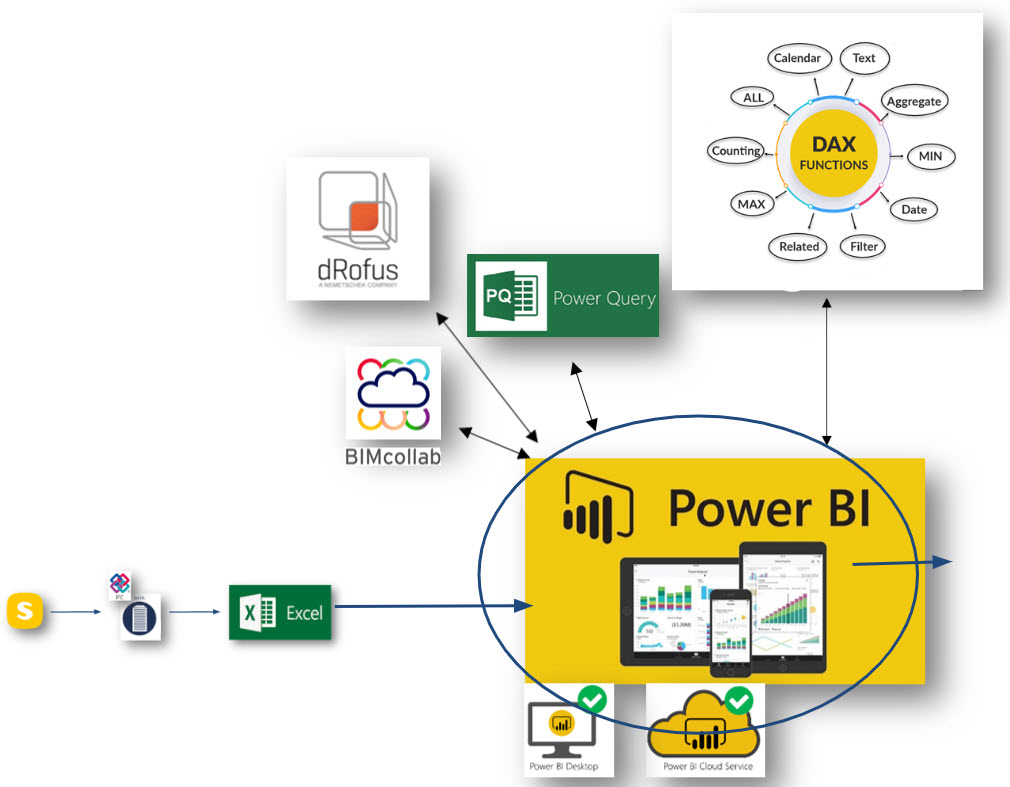
In order to visualize data, it must first be gathered in one place.
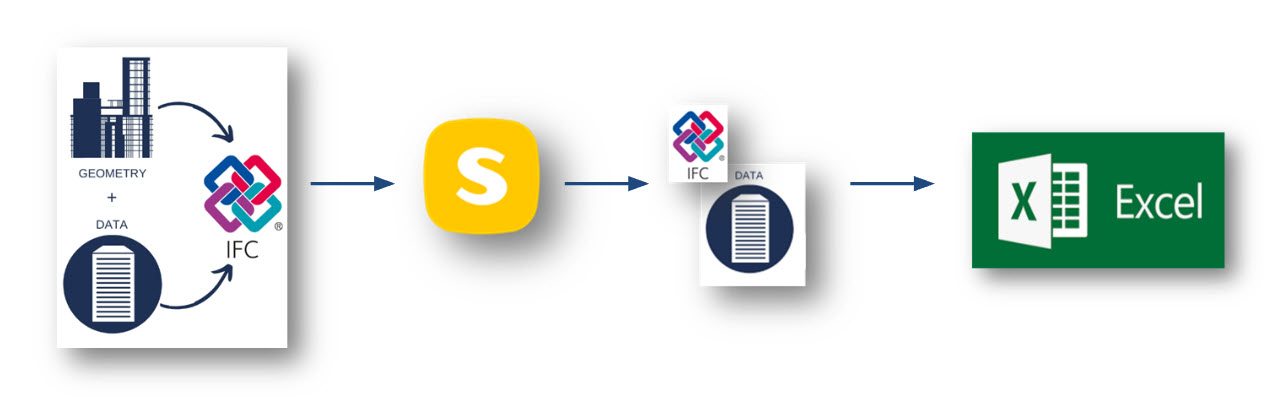
During the presentation, Nicolas provided an example of using IFC models.
To begin, he combined the models into one federated model using the Solibri program.
It can be presented schematically in this way:
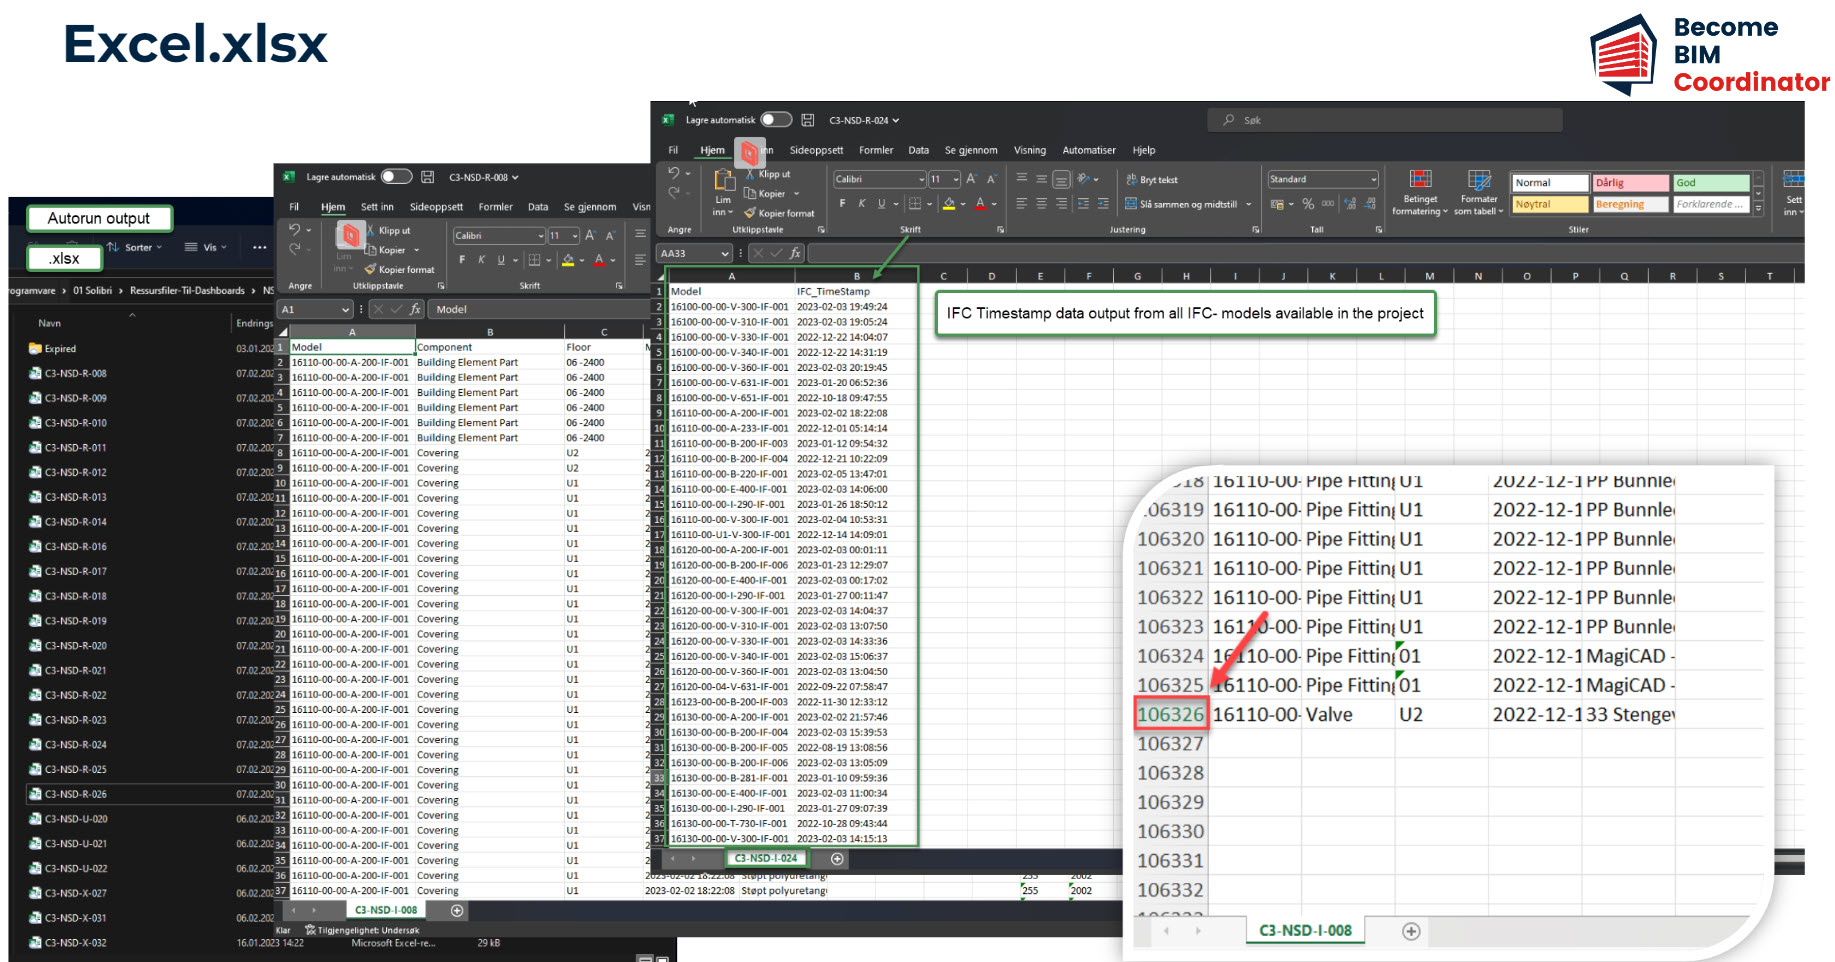
Then, using data from the models, we create an Information Takeoff in Solibri. Thanks to this tool, we are able to generate data reports in Excel format.
Our model data is now presented in an organized manner on a spreadsheet.
Other Sources of Data
All the data we collect will be visualized in Power BI. However, IFC models do not always have all the necessary data that we want to show in Power BI. This is why we can use other data sources.
During the presentation, Nicolas demonstrated how they used data from dRofus and BIMcollab applications
Visualization of BIM data in PowerBI
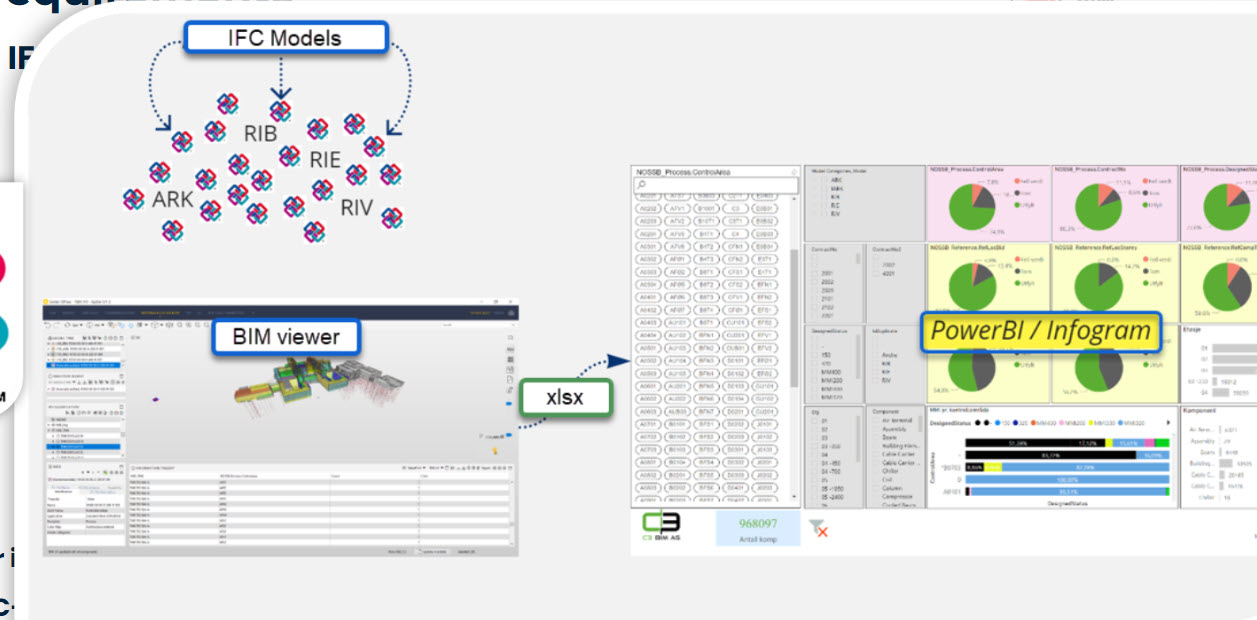
Once all data is gathered from various sources, we can use the PowerBI tool to present it in various diagrams.
Here is a simple example of how we can use diagrams to display the MMI status of each model element. (For more information about MMI, click here.)
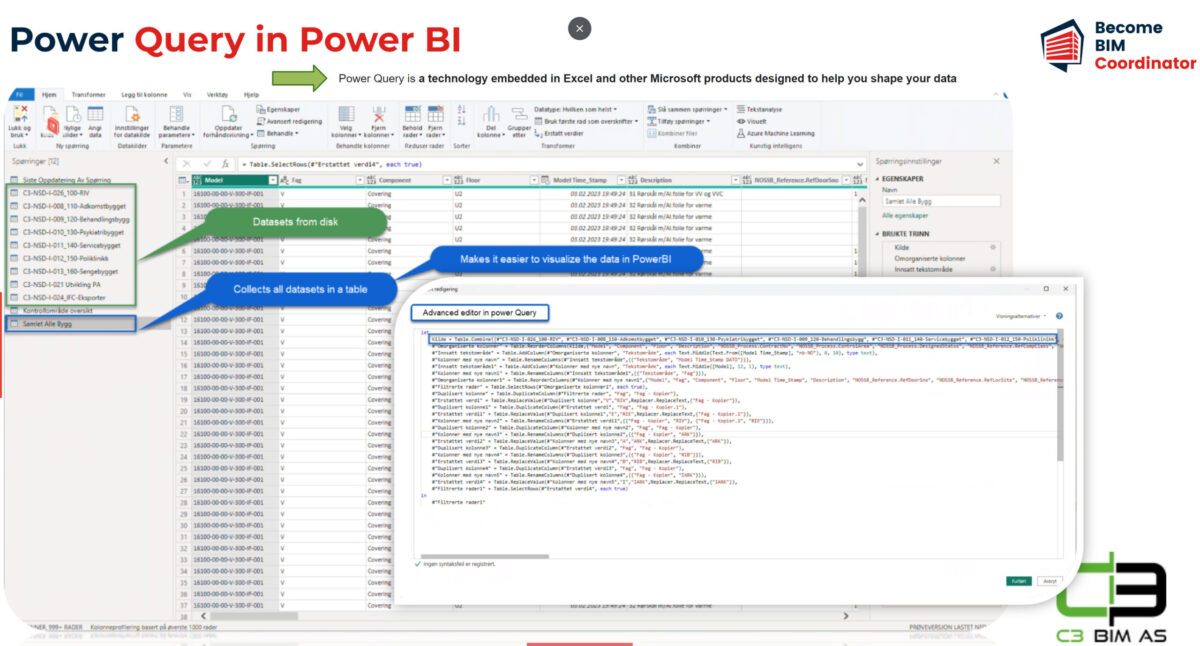
Shaping our data in PowerBI - PowerQuery
After gathering data from various sources in PowerBI, it is important to structure it in a meaningful way. This can be accomplished using special functions in PowerBI called PowerQuery.
PowerQuery provides the flexibility to connect PowerBI to many different data sources and transform the data as needed. Nicolas uses this tool as an addition to PowerBI and other functions.
PowerQuery can also combine multiple tables into one, making it easier to model the data and create a strong foundation for visualizing graphs and statistics in PowerBI.
PowerQuery is an essential tool for any BIM professional who wants to leverage the value of model data.
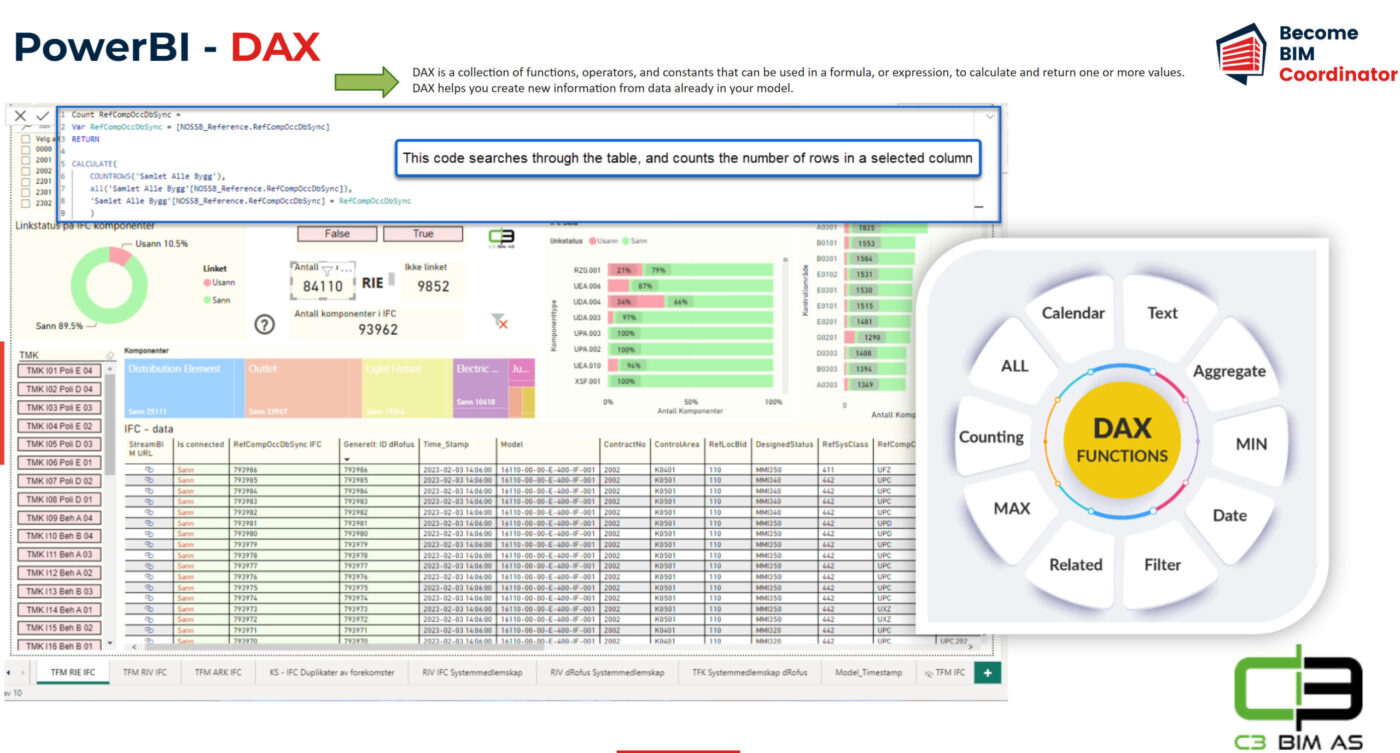
Shaping our data in PowerBI - DAX
Nicolas and the team at C3BIM are also utilizing Data Analysis Expressions (DAX) to improve statistics and visualization in Power BI. DAX is a formula expression language that can optimize data analysis.
DAX is a crucial component for most calculations in Power BI. It includes functions, operators, and values that enable formula-based data shaping, which was not possible before.
If you would like to learn more about DAX and how to use it, there is a free Microsoft course available that will teach you the solid foundations:
Fill out the form get ALL materials from the webinar
Remember to click the link in the confirmation email to sign up.
This form collects information that I will only use to send you additional materials from the webinar. No spam, I promise, I hate it too.
What will you find in the BIM Coordination Guide?
Interactive BIM Coordination guide in the form of Notion notebook
A lot of tips, graphs, mind maps, and practical exercises
Guided step-by-step process on how to conduct simple BIM Coordination
Exercise files will help you go through each homework
Thank you!
You have successfully joined our subscriber list. Check your inbox. Confirm email in order to get access BIM Case Studies from the biggest Norwegian projects.
Reasons to Subscribe to the BIM Corner List:
BIM CASE STUDIES
After reading this guide, you will learn:
How BIM is used on the biggest projects in Norway
What were the challenges for the design team and how were they solved
What were the challenges on the construction site and what was our approach to them
News From BIM World
Every Thursday you will get a package of news and useful links from the BIM world.
No Hype
Just real content that’s meant to make a difference in your BIM knowledge.
This site uses cookies to offer social functions, analyze traffic and conduct remarketing activities. Details can be found in the privacy policy (info button).


This can aslo be done in Bexel Manager