
How do you know if you are actually improving in what you are doing? Do you do better or worse than for example for one year ago? Metrics, or measuring performance, is a significant part of VDC and can help us reach our goals and control the status on the way to them. Would you like to use a system to improve the project’s performance? We invite you to read on!
What gets measured, gets improved.
Peter Drucker
Originally, the idea was to write just one article about the metrics. It was a good plan, until I started writing… and ended up with a text of 13 pages. Because of that, it was decided to split the topic into two articles – in this first part, which you are reading now, we will cover mostly the theory. We will look at the benefits of introducing use of metrics and their different types. In the next article, we will see how it looks in some practical examples.
Table of content
1.Background
Let’s refresh our memory: VDC, which stands for Virtual Design and Construction, is a methodology first introduced by Stanford University in the early 2000s and since then has been used in many countries all over the world. You can read the basic concepts of VDC in our previous article HERE.
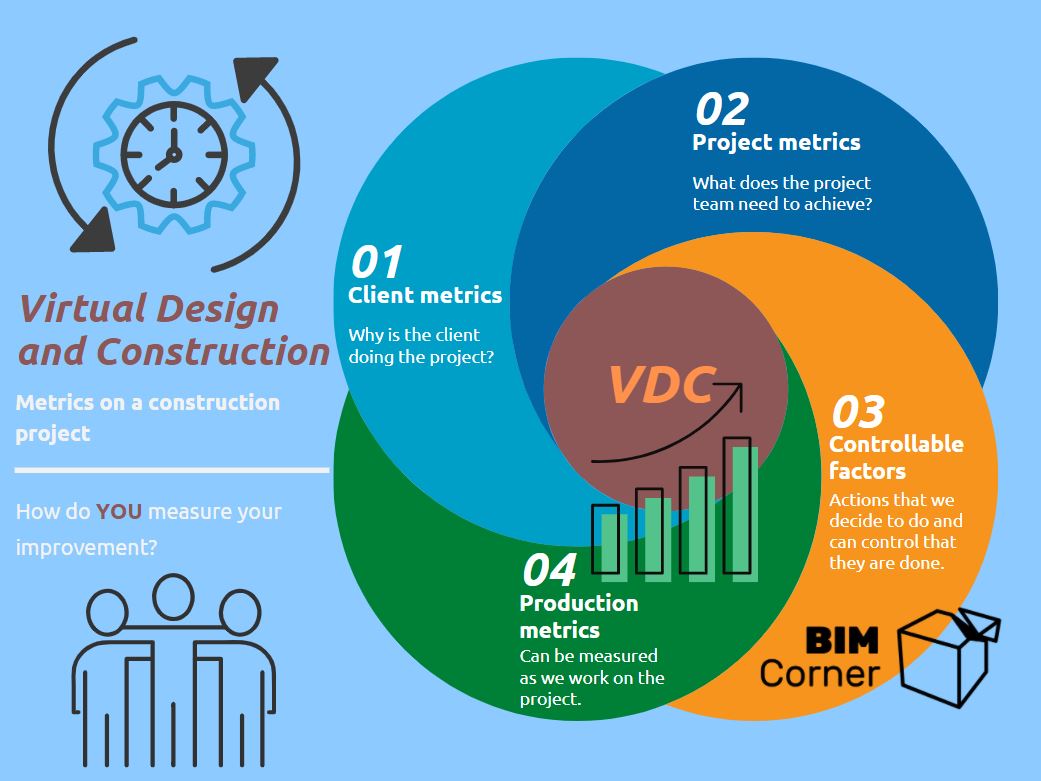
Metrics is one of the key features of the VDC concept. It is applied to all of the parts of the methodology. Let’s have a look at this simple diagram:
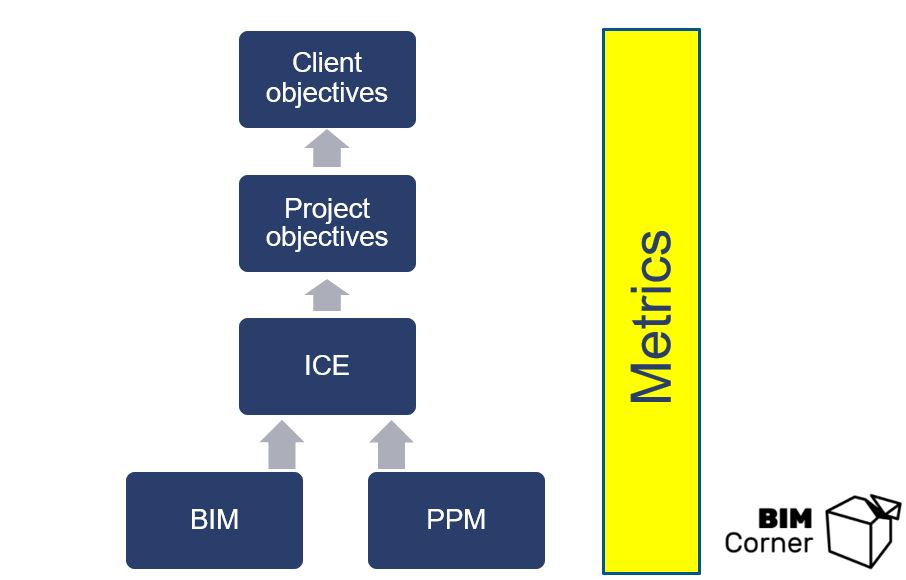
We can clearly see that metrics affect all of the parts of VDC: Client and business objectives, project objectives, ICE-sessions, BIM and PPM. It should not be a surprise, since as Peter Drucker, an expert and leader in the development of management education, put it: “What gets measured, gets improved.” And the whole VDC is putting a lot of emphasis exactly on continuous improvement.
2. What are metrics in VDC?
What are metrics? From many different definitions, I have found this one from Investopedia most explanatory:
Definition: Metrics are measures of quantitative assessment commonly used for assessing, comparing, and tracking performance or production. Generally, a group of metrics will typically be used to build a dashboard that management or analysts review on a regular basis to maintain performance assessments, opinions, and business strategies.
It is important to make a note that metrics are commonly used in many different industries. For example, they are an important part of LEAN methodology. One can wonder: why are they not so often used in practice in the construction industry? And here is where VDC comes into the game. Because VDC puts metrics into a system that is adjusted to specifics of the design and execution of construction projects.
3. Types of metrics.
Before we go to the practical examples and setting up the metric system in a project, let’s think a little bit about the types of metrics. Why? Because for different stages and different project participants, distinct metrics will be relevant.
Metrics can be categorized in many ways. Here, following the VDC practice, we have split them into four groups: client metrics, project metrics, controllable factors, and production performance. As we will learn more in the following points, all of them are connected with each other.
3.1. Client metrics.
Why is the client doing the project? This question should act as a base for establishing the client metrics. Let’s assume that we have a typical building project – for example a 10-storey office building. Why does a client want to build it? Some simple answers are: To get a usable and operable building, which is sustainable, in addition to the fact that it is delivered on time, according to the quality and within the budget. It all sounds really practical, however, what does it exactly mean? We need to make it more specific, to get a joint understanding. Here are some examples:
-
Building delivered on time for opening date 08.06.2022.
-
Annual CO2 emissions (kg CO2 / m2 / year): <20.
-
Number of parking spaces after completion: 400.
-
Project delivered within the budget of $1,585,000.
3.2. Project metrics.
What does the project team need to achieve? Following the previous example, the team has to deliver the building within the budget, according to the time schedule and quality, and all this with appropriate safety. How can the metrics be used to help in achieving that? Here are some ideas – note that we can connect some of them to the client objectives:
-
Complete the project 31 days ahead of schedule.
-
Achieve target cost with $255,000 reduction of original cost estimate.
-
Number of failures after the project completion = 0.
-
No accidents during construction: number of accidents = 0.
3.3. Controllable factors.
Tu put into simple words, ‘controllable factors’ are the actions that we decide to do and can control that they are done. After measuring what was accomplished we can learn from the result and improve until the next measurement. So the key to understand this idea is that we have the control over the decided action. For example, we can decide to organize ICE-meetings (more about ICE-sessions in our previous article) every 2 weeks. Or we can decide to use the BIM model on all the meetings. The bottom line is: If it is done or not, depends solely on us – in contrast to the production metrics, which depend on actions of other project participants. Examples of controllable factors include:
-
Meeting participation (% of invited people participate in the meeting): >90%.
-
Involve all trades to evaluate opportunities for prefabrication (number of trades involved / number of all numbers: 10 / 10.
-
Update of 3-weeks look-ahead time schedule: weekly.
3.3. Production performance metrics.
The production performance metrics can be measured as we work on the project. We can decide on the production metrics, but we do not have direct control over them.
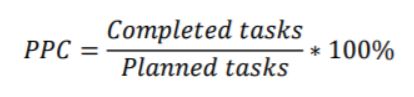
One of the more commonly used production metrics is Percentage Plan Complete (PPC). It may sound like a new useless abbreviation, however it is just metrics that shows a percentage of completed tasks out of the planned tasks. So for example if you have 10 issues on your meeting agenda and resolved 8 out of them, by simple calculation, it gives you the value of PPC on 80%, which is quite a good level.
PPC should be measured for tasks at each meeting and for planned deliveries at each maturity level.
Other examples of production metrics are (remember, that you cannot control their outcome):
- Design deliveries or submittals – example: 95% of design deliveries / submittals shall be reviewed without the need for revision and resubmittal.
- Potential change impacts (PCIs) – example: PCIs shall be approved within 30 calendar days from start of pricing.
- Change order – that means a change to a construction contract that changes the contractor’s scope of work. Example: change of orders shall be agreed on between the client and contractor within 15 working days after the change is identified.
- Latency, or in other words: time that passes between a question is asked or a request of clarification is sent, until an answer is received. One can also say that it is a kind of ‘response time’. Example: decision latency to be <5 working days, after an issue is raised.
- Rework hours compared to total hours – self-explanatory, can be also presented in percentage. Example: rework hours to be <5% of total hours used by craftsmen on concrete structures.
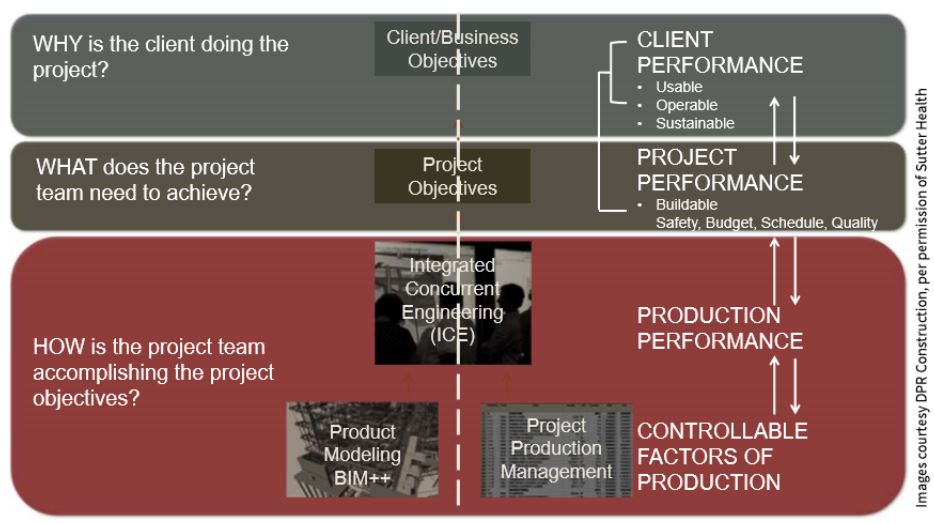
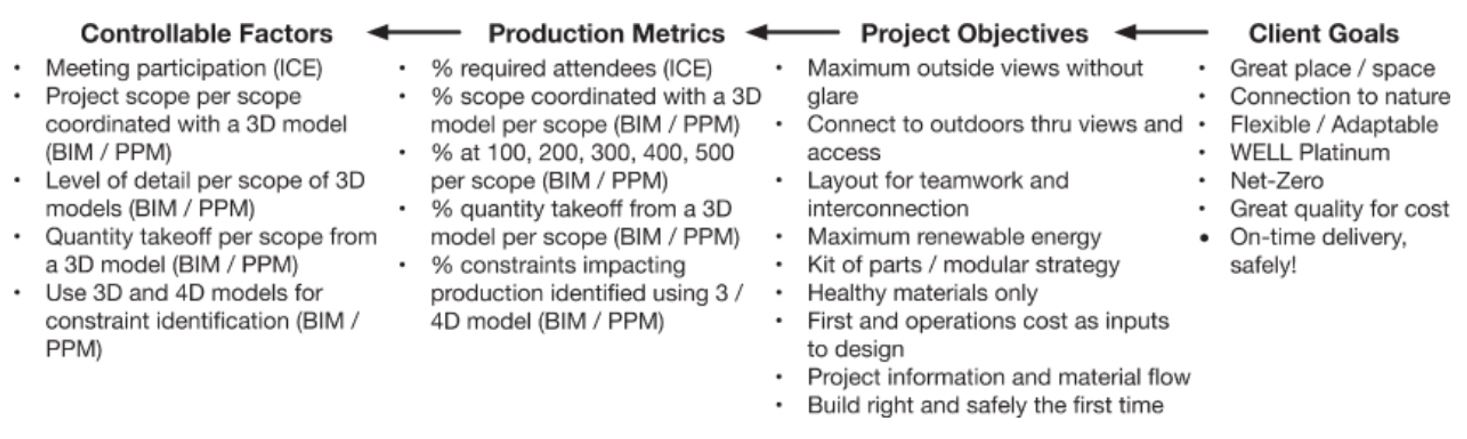
This graph from the book Integrating Project Delivery sums up the interconnection of client and project objectives, ICE, BIM and PPM, together with client’s and project metrics, production performance and controllable factors:
Summary of the first part - metrics in VDC.
So we know the different types of metrics. Lets see an example how they can be connected together – from the production to the client goals:
Okay, now we know (some) theory. In the next article about metrics in VDC we will look at the practical use, which is most interesting! In some neat points, we will see how the system of metrics can be set up on a project, presenting also key points about the whole idea of metrics.
This article is based on the Integrating Project Delivery book and VDC-Certificate Program in Norway, arranged by the Norwegian University of Technology NTNU together with Stanford Center for Professional Development, as well on the writer’s own experience.
We have also some questions to YOU! Do you have any experiences with using the VDC methodology? How do you think could metrics affect your current work, projects and the whole organization? Or maybe you do use the metrics already? Share with us your experience below the article!


Hi. I had never heard of VDC before reading this so it was all interesting stuff. We have been developing a tool which looks like it could be applied to this – measuring and presenting various matrics on a dashboard but linked to 3D visualisation of the phasing of a project. See what you think. https://www.linkedin.com/feed/update/urn:li:activity:6779722339287388160
Hello Eric,
Thank you for the comment! Visualization of metrics can for sure help all the project participants to understand its status in a better way. Especially for people who like to see things in a visual way, not only in tables and numbers. Your tool looks like a good initiative, keep up with the development!
Best regards,
Konrad