

Data analysis is one of the biggest traits that gives us BIM, yet many professionals struggle to effectively extract and analyze the rich information contained within their models. While Power BI has gained significant traction over the past five years, achieving seamless Power BI and BIM integration remains challenging. However, with the right approach and implementing automations in IFC viewers, you can successfully establish a reliable IFC to Power BI connection and perform meaningful analysis.
This guide will walk you through the basics of Power BI and Solibri connection. We are going to import a single model to Power BI, from initial export through final analysis and visualization using Solibri as your integration bridge.
What You'll Achieve
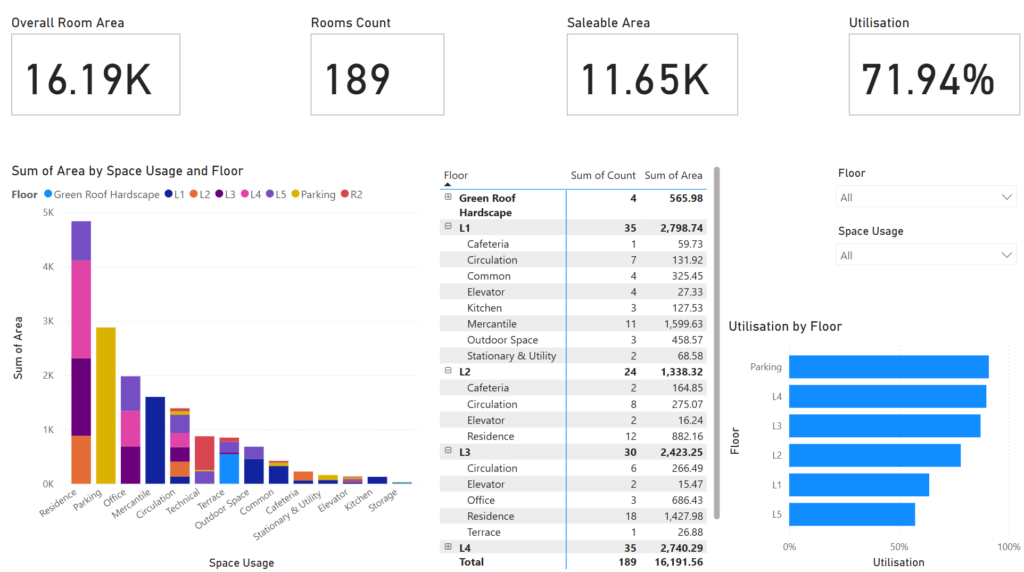
By following this Power BI and Solibri connection tutorial, you'll create a comprehensive Power BI dashboard that includes:
- Summary cards displaying Room Area, Room Count, Saleable Area and Utilisation rate
- A simple DAX measures to perform calculation on your data
- Visual charts showing space distribution by classification and floor
- Matrix tables for detailed data breakdown
- Utilization ratios per floor analysis
The end result will be a dashboard that transforms IFC data into actionable insights for space planning and utilization analysis through effective Power BI and Solibri connection.
You can watch it on YouTube here:Step 1: Prepare Your IFC Export from Revit
Export Settings
Begin with your Revit model (this example uses the Snowdon Towers sample model). Before exporting for your Power BI to Solibri integration workflow, ensure your model is properly configured:
- Configure export settings - Only export necessary data to keep file sizes manageable
- Exclude unnecessary elements - Avoid exporting schedules and other non-essential data that could bloat your file
Quality Considerations
Remember that IFC export quality directly impacts your Power BI to Solibri connection results. Take time to review export settings and ensure all relevant spatial data is included while excluding unnecessary information.
Resources to help you with that:Step 2: Open and Validate Your IFC Model
Choose Your IFC Viewer
Open your exported IFC model in a capable IFC viewer. This guide focuses on establishing a Solibri Power BI connection, though other viewers can work as alternatives for Power BI - IFC integration.
Data Validation
Before proceeding with classification and export in your Solibri Power BI connection workflow, validate your IFC data:
- Review model integrity - Check for missing elements or corrupt data
- Fix critical issues - Address problems that could affect your Power BI BIM integration analysis
This validation step is crucial for ensuring reliable results in your final Power BI dashboard. Here are some other BIM Corner resources that might be of help:
Step 3: Classify Spaces and Prepare Data
Set Up Space Usage Classification
The power of using Solibri for Power BI - IFC integration lies in its ability to automatically classify spaces based on rules you define. This Solibri Power BI connection capability includes:
- Create classification rules - Set up automated rules that classify spaces based on their properties
- Handle unclassified spaces - Create rules for spaces that lack proper classification
For example, if you have "Common" spaces that are unclassified, create a rule that automatically assigns them the "Common" classification based on their naming convention or other properties.
Benefits of Automated Classification
This Solibri Power BI connection approach offers several advantages for your Power BI BIM integration:
- Consistency - Rules ensure uniform classification across all models
- Efficiency - New rooms are automatically classified when models are updated
- Independence - You're not reliant on designers' classification choices
- Customization - Classifications can match your company's specific requirements
Step 4: Create and Export Data Take-offs
Define Required Properties
Create take-offs that include all necessary properties for your Power BI - IFC integration analysis. For this Solibri Power BI connection example, include:
- GUID - Unique identifier for each space
- Name - Space name or number
- Floor - Floor location
- Space Usage - Classification category
- Area - Space area measurement
- Count - For counting rooms by category
Export Process
To complete your Solibri and Power BI connection:
- Generate take-offs in Solibri with the defined properties
- Export to Excel format - unfortunately IFC viewers don't provide direct connectors to Power BI
- Save to dedicated folder - Create a repository folder for all Power BI data sources
This organized approach makes it easier to manage multiple data sources and updates in your Power BI - IFC integration workflow.
Step 5: Import Data into Power BI
Initial Setup
To begin the Power BI BIM integration process:
- Open Power BI Desktop
- Click "Get Data" and select "Excel Workbook"
- Choose your exported file from and import the data
- Review the data - Perform a quick inspection to ensure data integrity
- Load the data - Click "Load" to begin working with your dataset
Quick Data Review
Before creating visuals in your Power BI BIM integration dashboard, take a moment to review your imported data structure and identify any immediate issues that need addressing. For this click on "Transform Data" instead of "Load".
Step 6: Build Basic Visualizations
Create Summary Cards
Start with fundamental metrics for your Power BI BIM integration dashboard:
Total Area Card
- Add a card visual
- Use sum of Area field
- Turn off data labels for cleaner appearance
- Enable title for clarity
Room Count Card
- Add another card visual
- Use count of rooms
- Configure formatting to match your design standards
Build Charts and Tables
Stacked Column Chart
- Display area distribution by Space Usage classification
- Group by floor for additional insight in your
Matrix Table
- Rows: Floors and Space Usage categories
- Values: Count and Area
- This provides detailed breakdown of space allocation
Step 7: Clean and Transform Data
Address Data Quality Issues
You may notice formatting issues in your Solibri Power BI connection data, such as floor names containing unwanted prefixes like "(ARCH)". Use Power BI's Power Query Editor to clean this data:
- Open Transform Data - This launches Power Query Editor
- Select the problematic column (Floor names)
- Use "Text after delimiter" - Extract text after space to remove prefixes
- Use "Text before delimiter" - Clean up remaining formatting issues
- Apply changes - Click "Close & Apply" to update your dataset
This cleaning process ensures your Power BI BIM integration analysis presents clear, professional results without requiring changes to the original BIM model.
Learn more about data cleaning in this entry: Data Cleaning - All You Have to Know.
Step 8: Create DAX Measures
Saleable Area Calculation
Create a measure that calculates only areas that can be rented or sold in your Power BI BIM integration dashboard:
FILTER(
Spaces;
(Spaces[Space Usage]="Residence") +
(Spaces[Space Usage]="Office") +
(Spaces[Space Usage]="Cafeteria") +
(Spaces[Space Usage]="Kitchen") +
(Spaces[Space Usage]="Mercantile") +
(Spaces[Space Usage]="Parking")
);
Spaces[Area]
)
This measure filters your space data to include only revenue-generating areas, providing crucial business intelligence for real estate analysis through Power BI BIM integration.
Utilization Ratio Calculation
Create a second measure to show the efficiency of space usage in your dashboard:
This measure calculates the percentage of total space that generates revenue, helping identify optimization opportunities.
Implementation
- Add saleable area card - Create a new card visual using your SaleableArea measure
- Create utilization visualizations - Use the Utilisation measure in charts and cards
- Build floor-by-floor analysis - Create bar charts showing utilization per floor
Step 9: Finalize Your Dashboard
Layout and Design
Arrange your Power BI BIM integration visualizations for maximum impact:
- Summary cards at the top for key metrics
- Charts showing distribution and trends
- Detailed tables for drill-down analysis
- Utilization metrics prominently displayed
Testing and Validation
Before sharing your dashboard:
- Verify calculations - Cross-check your measures against known values
- Test interactivity - Ensure filters and slicers work correctly
- Review formatting - Confirm all elements are properly labeled and formatted
Conclusion
This Power BI BIM integration workflow demonstrates how to bridge the gap between BIM data and business intelligence tools. By establishing a successful Solibri Power BI connection, you can transform static building information into dynamic insights that support better decision-making.
The key benefits of this Power BI BIM integration approach include:
- Automated data processing - Reduces manual effort and errors
- Flexible analysis - Enables custom calculations and visualizations
- Professional presentation - Creates stakeholder-ready reports
- Scalable solution - Can be extended to handle multiple models and data sources
As BIM and data analytics continue to evolve, Power BI BIM integration will become increasingly important for organizations looking to maximize the value of their building information models. The Solibri Power BI connection method outlined here provides a robust foundation for this integration.
Remember that data quality in your original BIM model directly impacts your Power BI BIM integration results. Invest time in proper model validation and classification to ensure your Power BI dashboards provide reliable, actionable insights through your Solibri Power BI connection workflow.
Did you like that post ? Share it with others !
We spend a lot of time and effort creating all of our articles and guides. It would be great if you could take a moment to share this post !
Share:
Comments: