

As we already know what attributes data has to comply with (part III), and what data types we can have in our dataset (part II), we have all the basics to work with the dataset we own and start to perform data analysis. Almost. First, we have to prepare our data set for analysis and data transformation.
Since no data set is errorless, we always have to include this step before performing any analysis or dashboard creation. Otherwise, the outcome is going to be unreliable, because we base it on an untrustworthy source. This process is called data cleaning and is the key part of the data management process. There are several actions that you have to undertake.
Table of Contents
What are the steps in the process of data cleaning?
The process of achieving high-quality data can be accomplished by iterating those four steps:
- Inspection
- Cleaning
- Verifying
- Reporting
At first this might look tedious and mundane, but as you will see in the examples, it can be straightforward. Indeed, it all depends on how big and chaotic data sets we receive. AEC usually operates on a limited amount of data (though its amount is rising steadily), but with poor quality.
Inspection
First, take a look at the data from a higher perspective. Your goal here is to detect unexpected, incorrect, and inconsistent data. Remember or note incorrect patterns – we will tackle those in the next step.
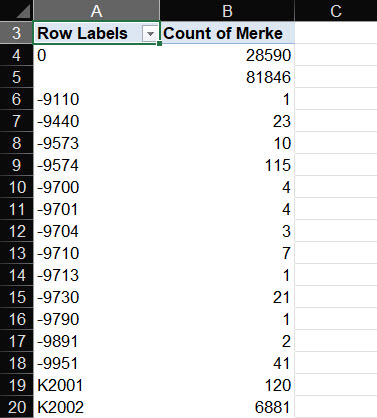
A good idea is to create a summary statistic (e.g. pivot table) and check whether values have typos or what patterns you see in different columns. If you have to statistically analyse your data (rather seldom in our branch), it is worth creating visualizations – they help a lot with identifying outliers and unexpected values.
Cleaning
Remove duplicates
Removing duplicates is oftentimes the first data-cleaning operation. Just as the most extensive. This is especially important when you are combining a few data sources. For instance, while federating models or creating an item-type schedule from schedules delivered by different disciplines.
To remove duplicates, you have to first find the value that is required to be unique. This might be an item number, a room number or an ID. It can also be multiple columns that altogether have to create a unique dataset (for example customer data – name, surname and address can have duplicates while looking only at one column at a time, but together they create unique datasets).
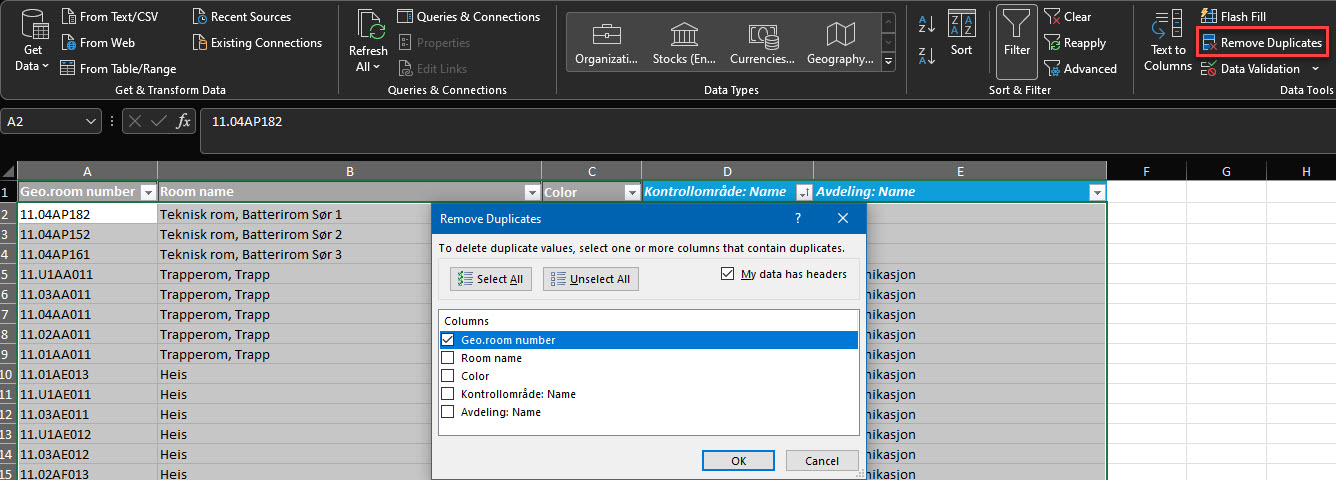
The easiest and low threshold operation is to dump the data into an Excel file and use the function “remove duplicates”. You choose which column(s) has to be treated as unique and Excel removes duplicates. Be careful here though, since you have no control over what records are being deleted. To mark duplicates before being deleted, you have to use the “conditional formatting” tool.
Remove outliers and irrelevant data
Irrelevant data is when the hits in the table don’t match your desired analysis. This can be for example exporting all categories “wall” while you want only to analyze the interior walls. Consequently, less data will make your analysis more efficient and in some cases – the only correct one (like when you are summing the wall area for internal walls).
Setting correct filters on columns will do the job with irrelevant data. Sometimes it is necessary to use another column to filter out irrelevant data. Example: both your external walls and internal walls have a random type name and cannot be easily distinguished by this parameter. But you know, that external walls have bricks as outer material. Including this column in the schedule would make it easier to filter out irrelevant data.
Outliers, on the other hand, are values that lay far away from most of the results. For us in construction, those mean oftentimes errors. An example is a price for one type of window. Let’s say most of them are between 300€ and 500€, but one type costs 2000€. You have to double-check if that is correct.
Outliers can be identified with the conditional formatting tool in Excel. Just choose the border threshold the data stands out and you will have them marked. Your decision is what to do with them.

Fix structural errors
Structural errors in data sets are typos, irregular naming conventions, incorrect capitalization, syntax errors, and wrong numerical entries.
When working with simpler data sets, for me, the easiest is to create a temporary pivot table to find out where structural errors occur (the same method as in the inspection stage). Having such a list helps me to correct errors until I receive a clean pivot table.
To fix structural errors commonly we perform these actions:
- Finding and replacing text,
- Changing the case of the text,
- Removing spaces and nonprinting characters (pilcrow, tabulator, line break).
Inconsistent data
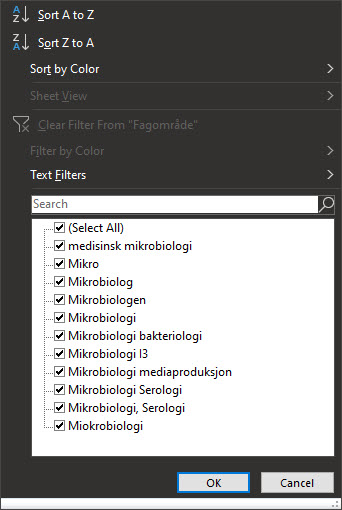
Different data sources might have a different convention on presenting values and thus this might create obscurity in the data set – we might be unsure whether preset values are the same category or not. Define what format/syntax is valid and then correct the other values.
Actions are similar to those performed to fix structural errors: replacing text, removing characters, etc.
Below in the table, there is an example of inconsistencies across multiple models. Having those in data might lead to incorrect calculation of the equipment amount per room.
| Source | Consistent data | Inconsistent |
|---|---|---|
| Room program database | AA.1023 | AA.1023 |
| Arch. Model | AA.1023 | AA 1023 |
| MEP Model | AA.1023 | 1023 |
| FM database | AA.1023 | AA.1023 |
Handle missing data
Missing values (blank or null fields that should contain data) might cause problems during data analysis and especially during mathematical operations on non-existent data).
What we should do with the missing data strongly depends on what we need this data for and how many data fields are empty. You can undertake one of the following actions:
Drop
If missing data happens rarely or its value is not necessary to perform the analysis you can just drop whole rows containing such data. If there are many missing values in one column, you can drop the whole column.
This can be the case of calculating big sums. If you see missing data on cheaper elements that slightly influence pricing, the better solution might be to drop these rows instead of trying to fix the data. But remember – you are now losing information.
Impute
If missing data follows a pattern or it is crucial to include it, imputing might be a good option. It means estimating the missing value based on other observations.
A good example might be a price of an element. If the price is missing for 1 window type out of 20, then looking at other types and values (dimension, material, noise insulation class, etc.) you can impute the price.
Flag
If you find a pattern in missing data or you assume that missing data is informative in itself, you should consider flagging it. It means – treating the missing value as a value. Sounds illogical? Let’s take an example of a door schedule with a column labelled “Fire rating”. What if one-third of them have no value? In fact, it can mean, that those doors don’t have any fire rating class. Consequently, it is not a null value, but an informative category “None”. You should create such a flag and assign it to all missing values in that column.
In the table below, there is an example of missing values:
| ID | Name | Dimension | Fire Rating |
|---|---|---|---|
| ... | ... | ... | ... |
| ID-86 | Internal Double Wooden Doors 1990x2090 | 1990x2090 | |
| ID-87 | Internal Single Wooden Doors 990x2090 | 900x2100 | |
| ID-88 | Internal Double Steel Doors 1990x2290 | EI30 | |
| ED-89 | External Aluminium Single Doors with Panel 1390x2090 | EI30 | |
| ... | ... | ... | ... |
This table shows an example what we could do with the missing data while preparing for analysis door schedule (Drop “External Doors” row, Impute values in the “Dimension” column and Flag “Fire Rating” missing values with “None”).
| ID | Name | Dimension | Fire Rating |
|---|---|---|---|
| ... | ... | ... | ... |
| ID-86 | Internal Double Wooden Doors 1990x2090 | 1990x2090 | None |
| ID-87 | Internal Single Wooden Doors 990x2090 | 900x2100 | None |
| ID-88 | Internal Double Steel Doors 1990x2290 | 1990x2290 | EI30 |
| ... | ... | ... | ... |
Verifying
Reporting
It is a good habit to log what changes you have made to the raw data set. You might find out the systematic reason why data was incorrectly entered in the first place. Maybe, it is possible to use this report and improve the data creation method?
It is also worth attaching such a report if you are forwarding the data to somebody else for analysis. Especially if you don’t have sufficient domain knowledge. Maybe some data you have corrected is incorrect in the end? Or that you have skipped data that is actually crucial? A domain expert would know it at a first glance.