
Let’s begin with the obvious- a lot of clutter morphs into chaos, both in an apartment and in a building design as well. In a flat we tend to sort things in wardrobes while in a building project we can present information in a database.
Depending on what kind of data it is, we group it in a specific way. Invoices are grouped according to the dates, sub-contractors according to their field, while building elements… well, that’s a good question. Rooms, spaces, zones, items, instances, systems, components. Building elements BIM dictionary is extensive and you can easily get lost at what is what.
Understanding the structure and functioning of the database combined with the model is the key to apprehending the whole process of Data Driven Design. Let me show you the way to present building information in a database so it is understandable and create logical integrity even being represented as just words in a tables.
The following article is included in the Data in BIM series. In case it’s the first post you came across, I encourage you to read the introduction "Data-Driven Design Explained in One Guide". I describe there the series, it’s table of content and describe the concept of Data-Driven Design. All that to make sure you can get the most out of the series. Have a good read.
Table Of Contents
1. How does a Designer present building information within a BIM Authoring Tool?
The information found within BIM Authoring Tools is spatially interdependent. If a classroom is situated on the same floor as the school office, then they will be displayed together in one view, regardless of their different functions.
Objects are assigned graphically to the rooms that they occur in. In the main project view we see only the lowest level – objects instances (specific doors, ventilation ducts, etc.). To find the hierarchy and relationship between them you have to open properties of each object individually. I present below the hierarchy and value inheritance according to the IFC standard (more about it here).
- Kinds of the objects – IfcObject
(wall, slab, doors, component) - Families of the objects – IfcElement
(internal walls, furniture) - Types of objects – IfcBuildingElement
(internal walls 100mm) - Instances of objects – IfcWall
(3 partition walls of the same type)

Not only does such grouping help to move around in 3D environment, but also it helps to model efficiently. The problem arises the moment we want to extract the precise set of information, such as:
- How many different types of doors do I have? And how many instances of each type?
- In which rooms do I have partition walls type W-01?
If I change that type of wall how many walls int total does this affect?
To answer such questions, we have to each time create different schedules. And that requires a lot of effort to achieve the desired effect.
More advanced users of modelling software uses Dynamo or Grasshopper to harvest requested data. And that ain’t an easy solution either.
2. How to present information in a database?
In modelling tools we can easily discern and name kinds of objects. We see that a wall is a wall and a lamp is a lamp. In a database we do not have spatial information, therefore, neither offices nor objects can be grouped based on how they look or where they are. Instead, we structure them based on the function they perform.
Functions
While creating a database we do not separate the rooms based on the floor they are located at, but in accordance with the departments that logically divide the whole building. Why you ask? Because at such an early stage of design, there is usually no scheme available. Furthermore, such grouping allows us to control the area of the offices that meet the specific function.
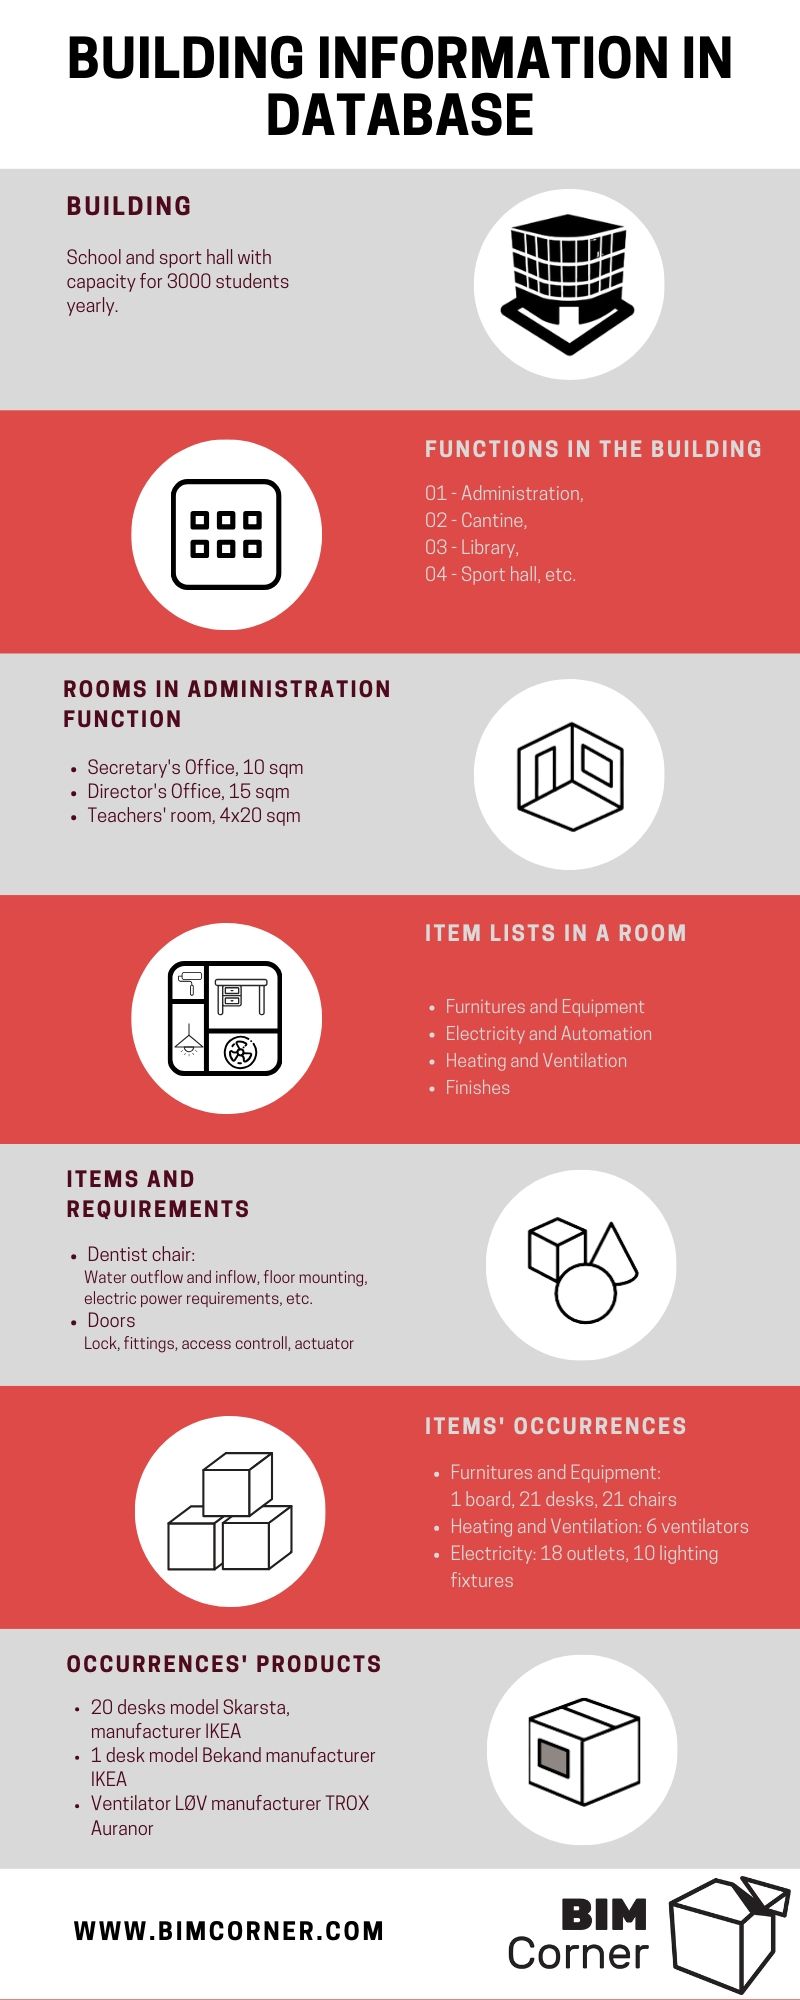
Let us assume we are designing a school building that can serve 3000 students yearly. In the beginning we choose the functions which divide the building:
- Administration,
- Canteen,
- Library,
- Gym, etc.
At that moment we can determine planned area of each of them. Thanks to that, during development of the design we have a control over designed vs planned area requirements.
Rooms
The next stage is to plan offices in every department. The administration department includes: the school secretary’s office, the principal’s office and teachers’ rooms. Although they might be located in quite different corners, they constitute one logical interdependent unit that performs the same function. The design begins to develop and departments have been allotted with the sum of the rooms programmed area – first data to validate comes to existence.
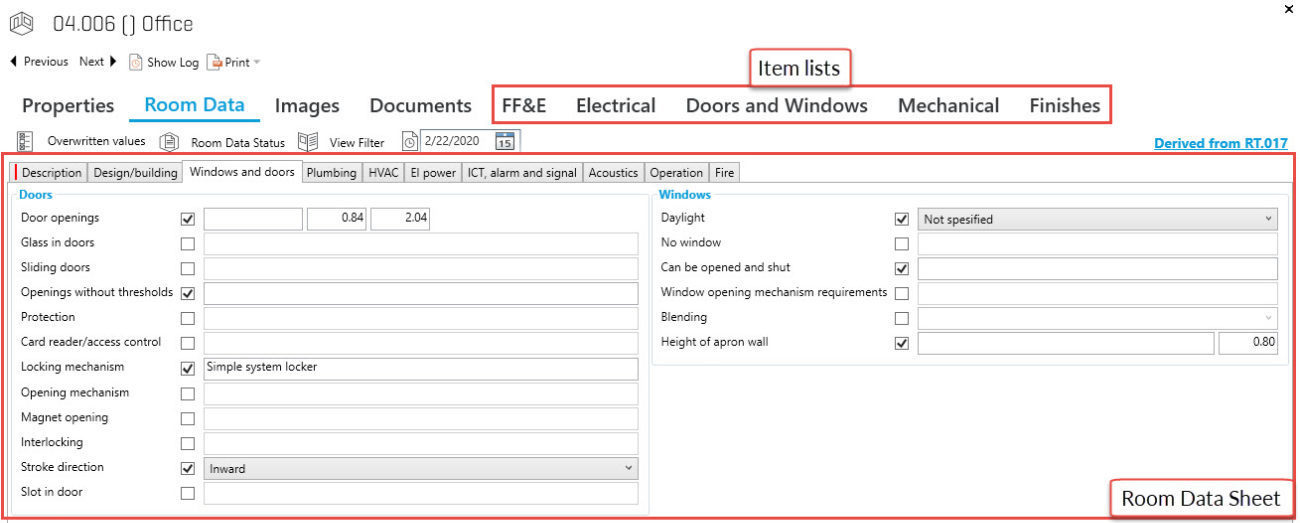
Room Data Sheet
Each office has its own requirements and properties set by the investor. Therefore, e.g. a classroom is to have 75 m2, soundproof at the level of 44 dB and windows along one wall. Amount of fresh air per person is required at 26 m3/h. The Room Data Sheet compounded this way will aid designers to model rooms and contractors to build them. The requirements often stems from the building code or regulatory rulings, therefore, we can ascribe them to specific rooms, which will make it much easier to progress with the design.
Item Lists
Going down the level even deeper- in the rooms there is bound to be some equipment. Aforementioned classroom should be equipped with the items from the following categories:
- Furniture & Equipment
- Electricity & Automation
- Ventilation & Heating
- Doors & Windows
- Finishes
The items are grouped in accordance with their field. For example, an electrician will not have to look through the whole list of items to find the ones that are required by the investor in order to have them designed or installed.
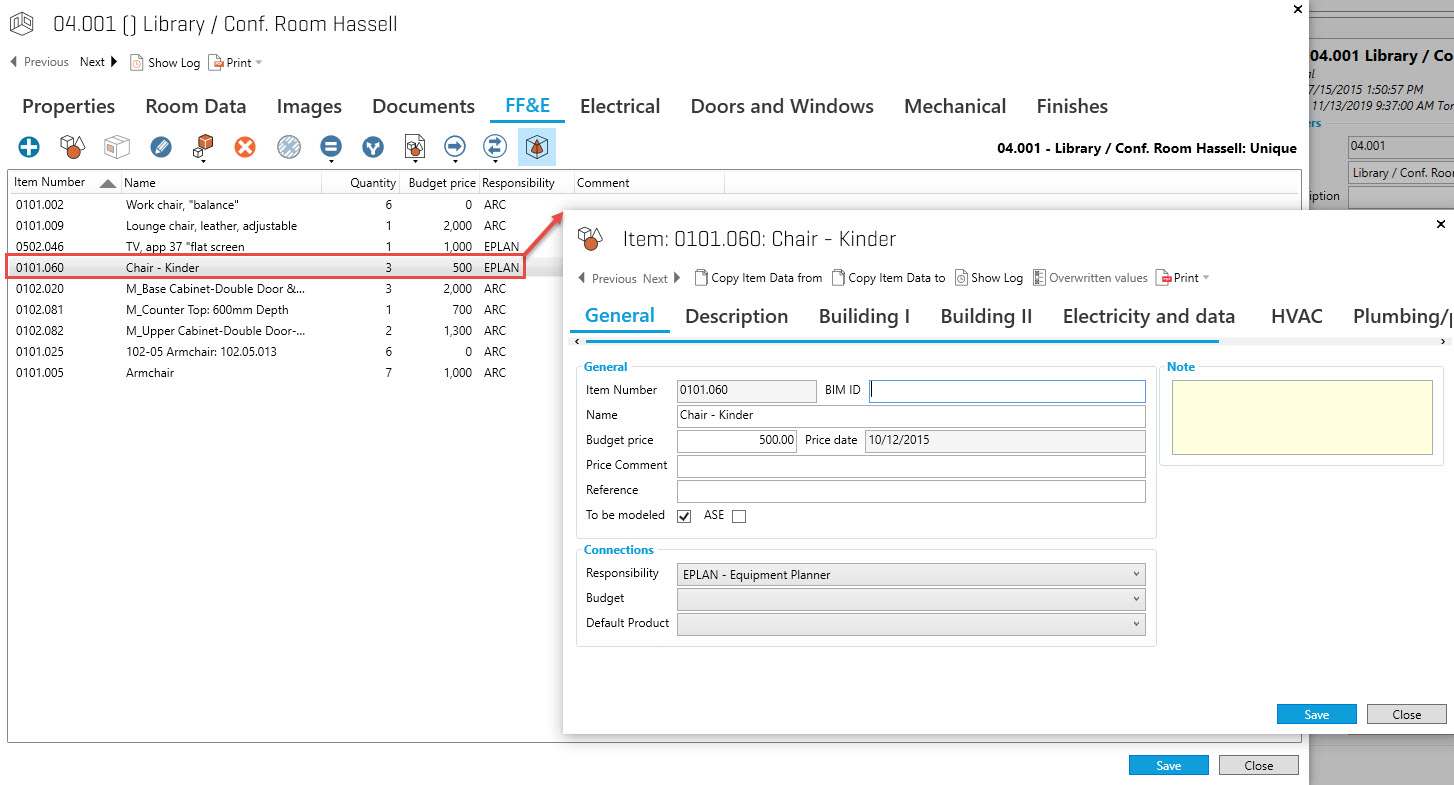
Items
Each of mentioned categories contains items that have their own properties. Only at that moment can we go down to the level that might be portrayed by with 3D items. For instance, a dental chair at the school dentist’s office must have requirements such as:
- Water outflow and inflow,
- Floor mounting,
- Electric power access.
Everything is specified in the item sheet and modelled. Another good example are doors. They consist of locks, fittings, access control, actuators and designers don’t model those accessories to not to unnecessary enlarge the model. However they can be placed in database without straining it. Furthermore the database can serve as a way to manage doors and windows schedule.
Occurrences
The next step is occurrence, i.e. quantity and kind of the items in a specified room. Keeping our class in mind, occurrences in each category might include:
- Equipment: e.g. 1 whiteboard,
- Furniture: 21 desks, 21 chairs,
- Ventilation & heating: 6 air ventilators,
- Electric: 18 electric outlets, 10 lighting fixtures,
- Finishing & fixtures: 75m2 floor linoleum, 90m2 walls painted white.
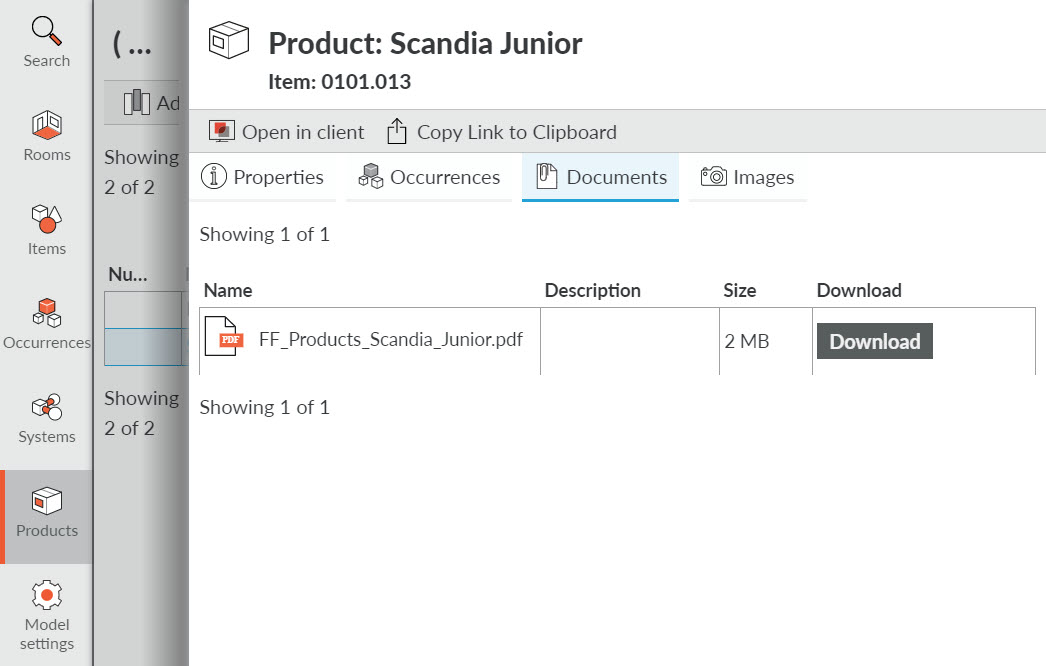
Products
Each occurrence constitutes a product. Therefore, 20 student desks might be Skarsta model by Ikea, whereas a teacher’s desk might be a Bekant model. Each of these products should have their own product tag, which then might be ascribed to the occurrence of that product in the design and forth during Facility Management.
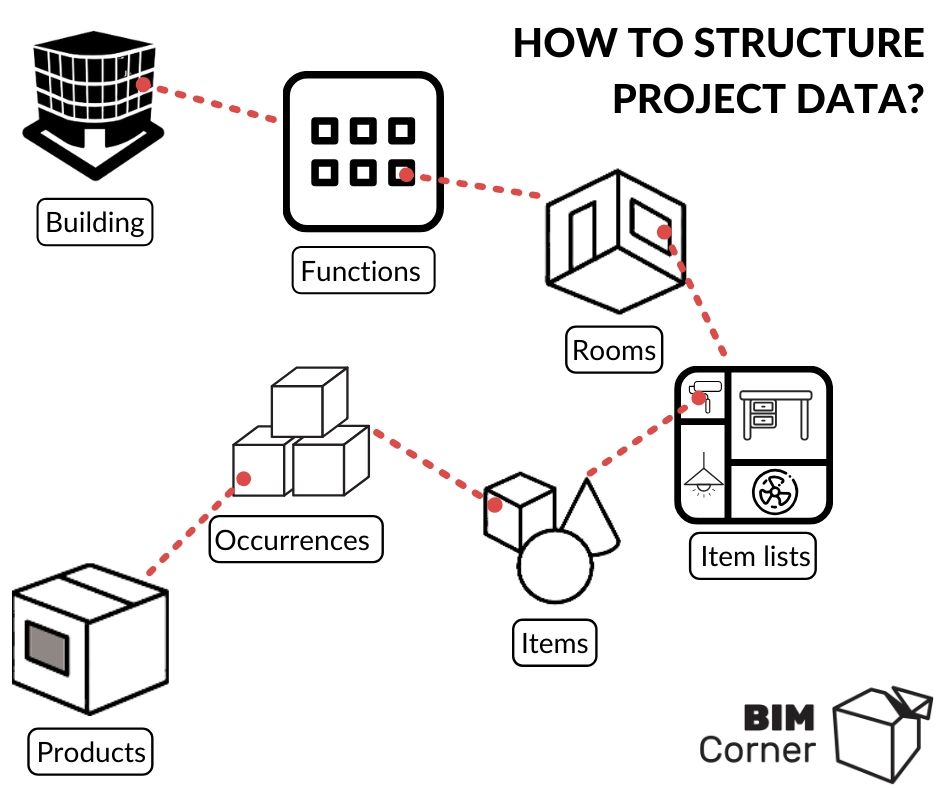
As illustrated in the graph, we begin from the general (building) perspective down with details, up to specific products delivered on the construction site. At the database we can go down to the level of bolts and threads, but the same procedure is applied as in modeling- we should finish in the place where no more useful information is needed. Proper Level of Information (read more about LOI) is the key.
3. Example of information structure on the hospital project
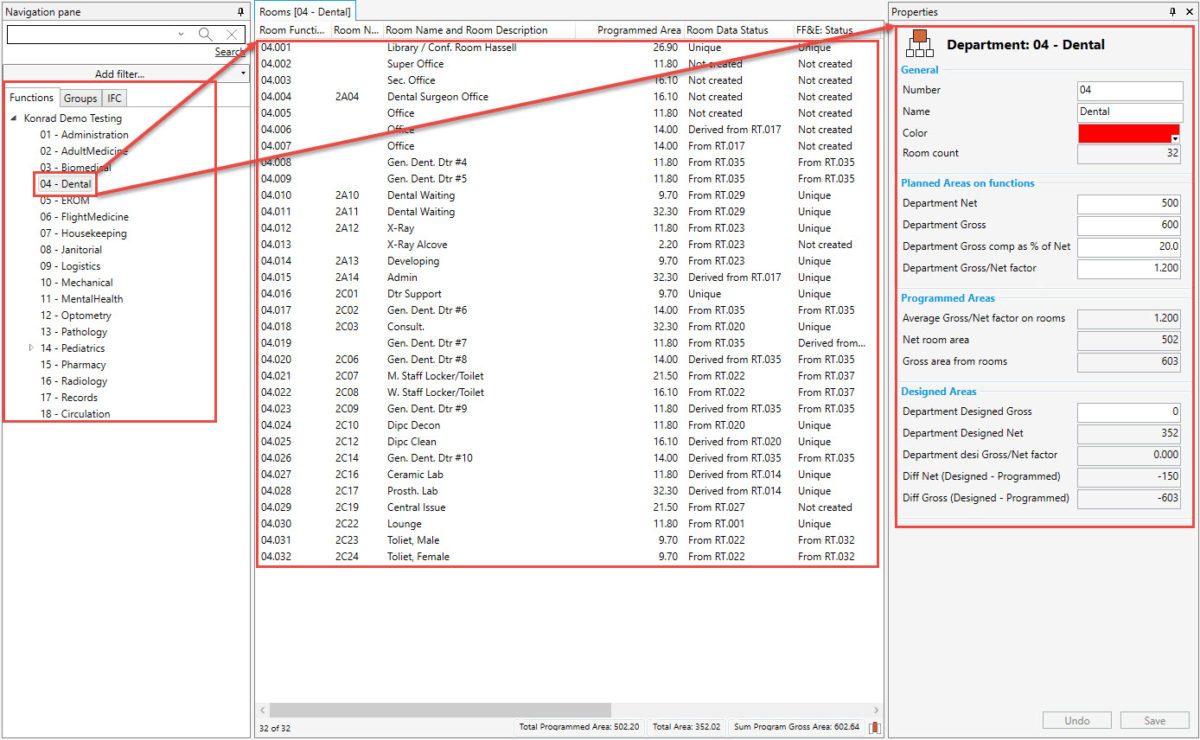
Now, let me show you how to structure the data logic with the aid of software. For presentation I used dRofus software, and information presented in a database of a hospital project.
The screenshot presented below illustrates grouping of the design after the division. Once one particular department has been chosen, all the rooms that are ascribed to that department with all the basic information and the information panel about the whole department is displayed.
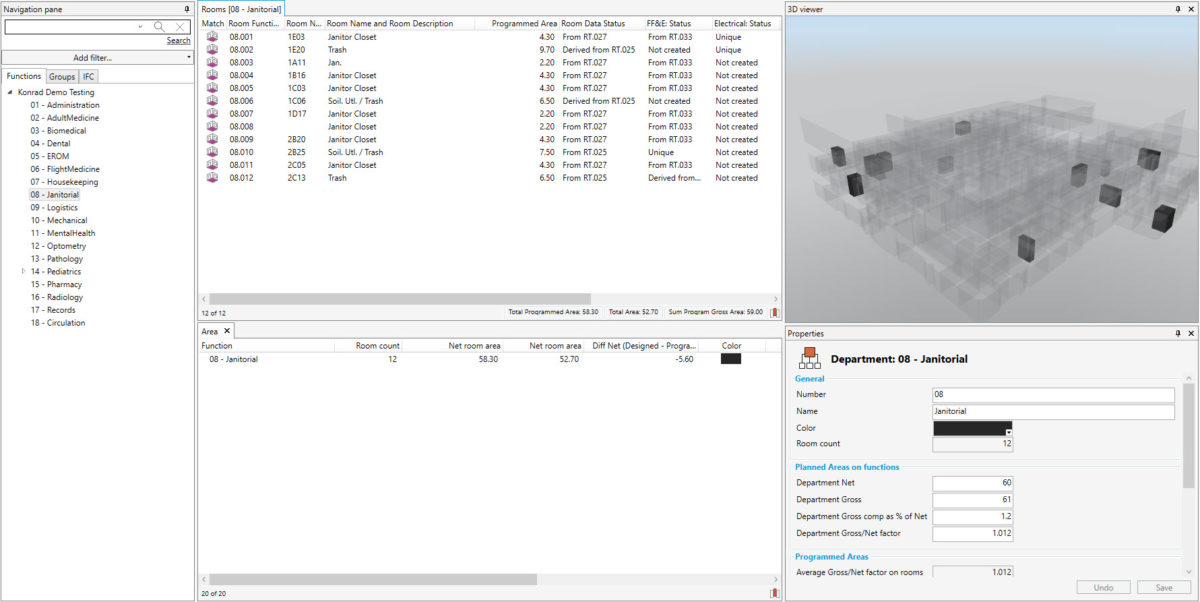
In the next step of the process, once we have started modeling we can mark the rooms from that function in the model. As shown below, the rooms are not adjacent:
Once one room from the list above has been chosen, the program directs us to the subsequent tables: room chart (where we can put forth the requirements that are imposed by the investor) as well as the item categories that are to be included in that room.
Then in the next category there are items with their placement in that particular room. After opening the item, the next table with the description of the properties of that item is displayed.
As well as product documentation
4. What are the advantages of presenting a building information in such way?
So, what are the advantages of grouping information in such a way? The most important are:
- Within just one click we have all the information about the whole department: the number of rooms, the category of each item and even the sum of all items in the chosen department.
- Ability to plan the function of the area both top- down (first defining the function of the area and then creating the room) and bottom- up (first creating the room of pre-set area while monitoring the sum of all rooms in that function)
- The data is placed in the tables connected with one another. We can freely move from general to a detail (from room to the particular occurrence in that room) or the other way round.
- The data is updated with specifications in a simple way (with the aid of few lines of information) with the development of the design.
Data Driven Design differs in its approach from the modeling approach in some important issues. Not only are processes different, but also the approach to managing and grouping of the data. All these activities help to manage the vast number of information, which in later stages of the design augments. And data management is going to be the topic of the next post.


Great Article. It makes Databases sound great
Thanks! They really are great 😉