Building projects contain a lot of data, which means they need to be managed and structured. Otherwise, it can really affect the return on investment of the project.
In this webinar, Konrad Fugas and Dipesh Thapa will aim to demonstrate how building data can be structured with best practice to enable connected and frictionless data flow in the design and construction process.
The following article is a transcript of the webinar held by dRofus on September 2nd, 2020. Recording with subtitles available above. If you prefer to read - below you will find full text together with some slides excerpts. The webinar refers to my previous post How to present building information in a database?
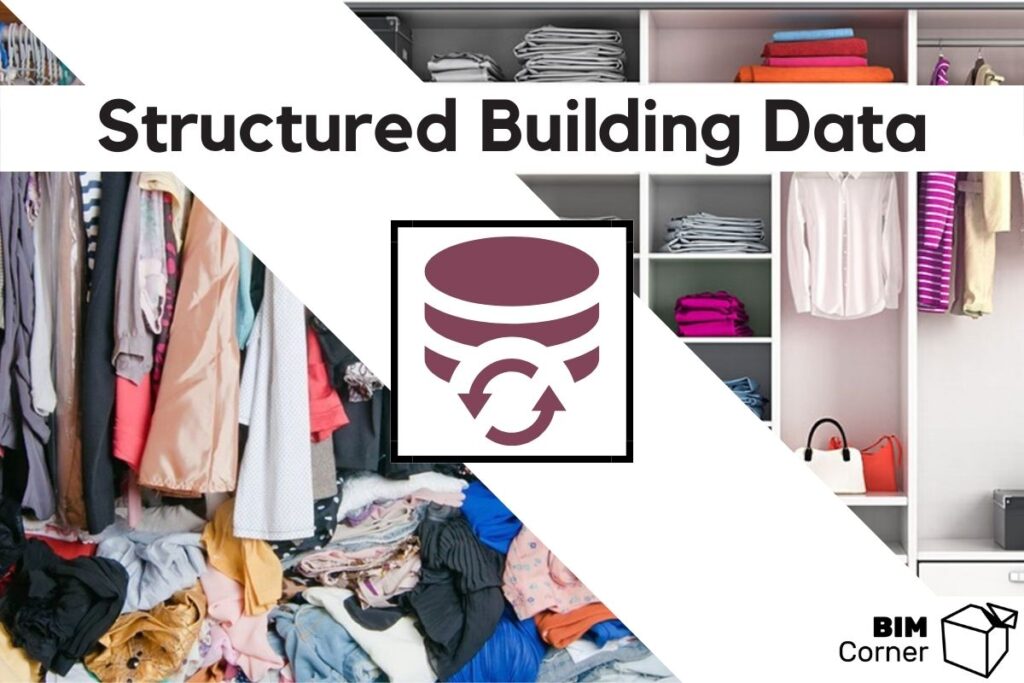
Structured Building Data and It's Frictionless Flow
Let’s begin with the obvious- a lot of clutter morphs into chaos, both in an apartment and in a building design and construction.
In a flat, we tend to sort things in wardrobes while in a building project we can present information in a… Exactly? In what?
My name is Konrad Fugas and I am going to guide you through the method of structuring building data.
Shortly about myself
I graduated from Warsaw University of Technology in Poland in the field of structural engineering. I have four years’ experience working on a construction site both in Poland and Norway so getting to work at 5 a.m., because the concrete is arriving is something that is not unfamiliar to me. And same as everyday chaos on the site and, unfortunately, in a construction documentation.
Then I started to work in dRofus and work with clients on governmental buildings, hospitals or schools, helping to organize and manage their data flow.
Together with five other engineers from Poland, we started a BIM Corner blog and our main mission is to spread the word about practical usage of BIM.
Privately I’m a triathlonist aiming for completing a half Ironman distance this weekend and a backpacker that has just finished sitting on the quarantine.
It's like setting the obvious: a lot of clutter morphs into chaos.
- In the apartment. Maybe this is us a few years back. Or our daughter exactly now.
- On a construction site. I bet this is our competitors
- Or this chaotic and gloomy office of our boss
Such pictures can go on and on: invoices, registers, Excel spreadsheets etc., etc.
Yeah, but you’re not here to look on what does not work. You want a solution. Let me ask some questions:
- What can we see in that picture? Wardrobe is sorted by the garment and colour
- What is here? Pathways and building materials placed according to their allocation and purpose
- And here? Invoices grouped may be according to the dates or contracts or some other data.
And I know that for now, it may sound like making a greater philosophy out of cleaning. But let me continue and ask what is the key here?
Each picture was sorted by the common parameter. Either be it colour, purpose, date or whatever. And how can we move it into the field of a BIM project?
Challenge: How to structure building data on a BIM project?
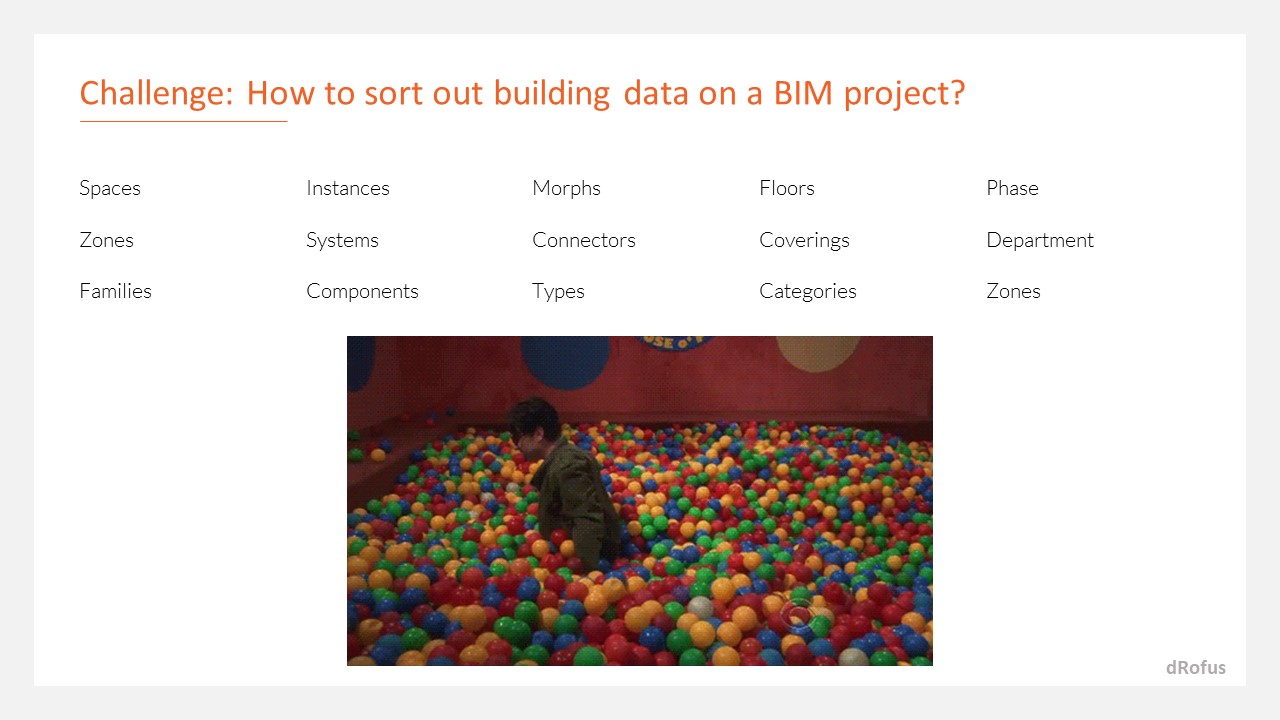
That’s the question and here’s the challenge. Rooms, spaces, zones, families, instances, systems, connectors, coverings, categories. Building elements BIM dictionary is extensive and you can easily get lost on what is what. And working on a project – do I even know what data do I have within a model? There are 10, 15, or more people working and modelling. Everyone is adding data to the model.
For me sometimes, when I’m starting a new project with a client and I’m looking into the model I’m feeling like a Leonard on this gif. Something is red, something is yellow, green, blue. But where is that information I’m looking for? How to find it? How to sort out building data? I know for now two possible ways:
- Within a modelling software,
- Using a database.
I’m going to describe them now.
Data structure in BIM Authoring Tools
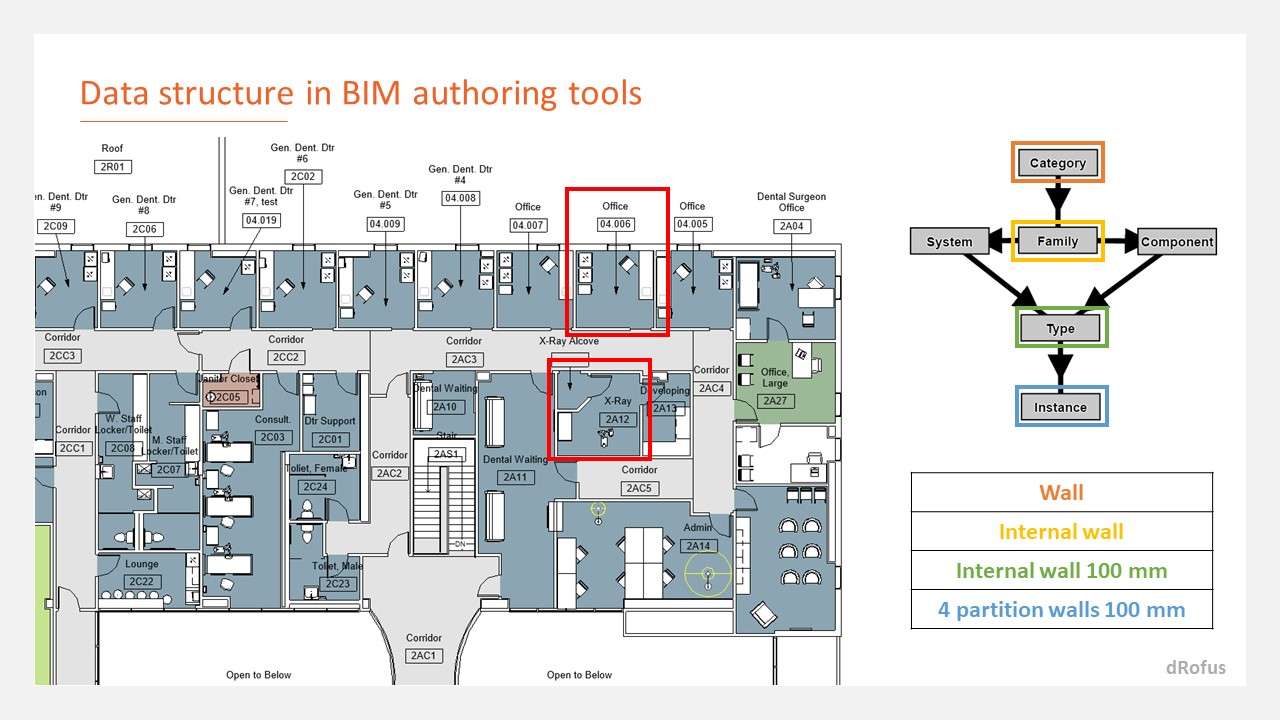
The information found within BIM Authoring Tools is spatially interdependent. If an Xray is situated on the same floor as the offices, then they will be displayed together in one view, regardless of their different functions and whether they are logically interconnected or not. Same goes for objects – we see here instances of chairs, patient beds and other equipment.
Objects hierarchy is shown on the right – parent-child relationship as it is in Revit (similar in other tools). Starting from the highest – category as an example of a wall and moving with details down to the instances placed within a view.
So basically, we structure things divided on where they are on the model (floor plans), or parent-child relationship.
Such grouping helps to move around in a 3D environment, and also it helps to model efficiently. But it has some drawbacks.
The challenge: aggregating data

The problem arises the moment we want to aggregate and then extract the precise set of information, such as:
- How many different types of doors do I have? And how many instances of each type?
- If I change that type of wall how many walls in total does this affect?
- In which rooms do I have partition walls type W-01?
To answer those questions, we have to each time create different schedules. And that requires a lot of effort to achieve the desired effect.
More tech-savvy designers use Dynamo or Grasshopper (more visit: Grasshopper tricks & tips) to harvest requested data. And that ain’t an easy solution either.
To sum up: Modelling tools are pretty miserable when it comes to managing the data. All in all that was not it was created for. Sounds obvious? Then why so many still do that?
How to present building data in a database?
The other possibility is to put data within a separate database. But then it comes a question: how to present them there?
In modelling tools, we can easily discern and name kinds of objects. We see that a wall presented in the model will be a wall in reality.
In a database, we do not have spatial information. We have just lines of text, tables and column. therefore, we cannot group objects basing on how they look or where they are. Instead, we structure them according to the function they perform. Let me show you the way to present building information in a database so it is understandable and create logical integrity even being represented as just words in tables.
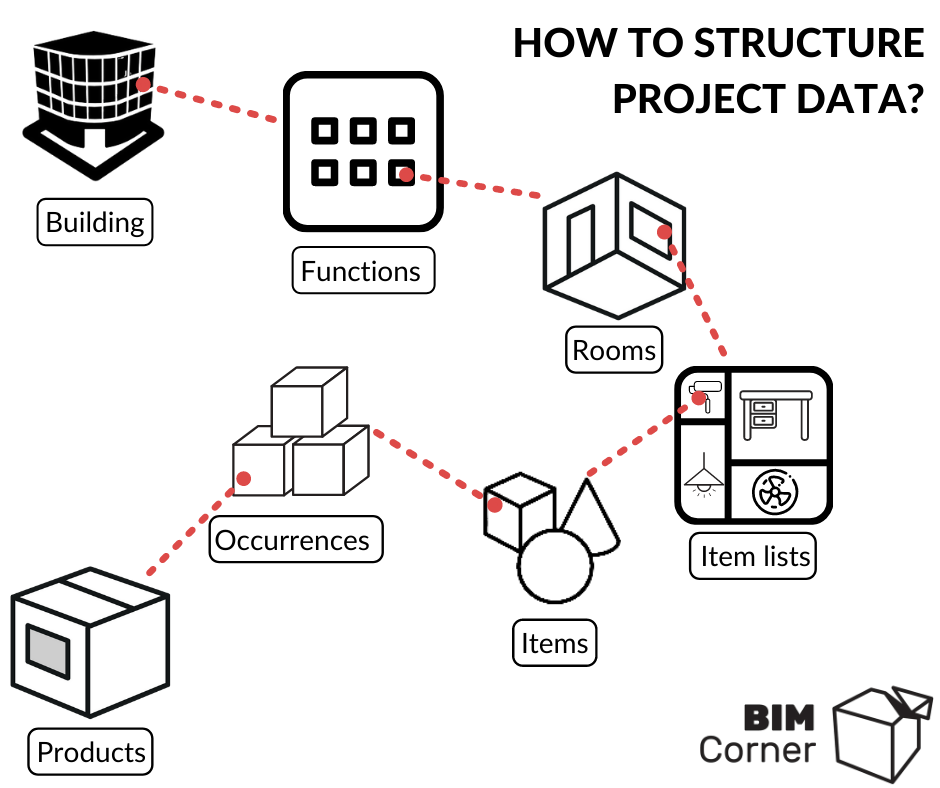
As illustrated in the graph, we are connecting the dots, so to speak. We begin with a general perspective and go down with the details. Starting from the building then we go to the functions within that building, then rooms within one function, item categories within a room, items within one category, occurrences of that item in the room and then tangible products that can be delivered on the construction site.
Let me present such sorting in an example project. We are gonna start with the building of a school with a sports hall that can serve up to a thousand pupils.
Functions
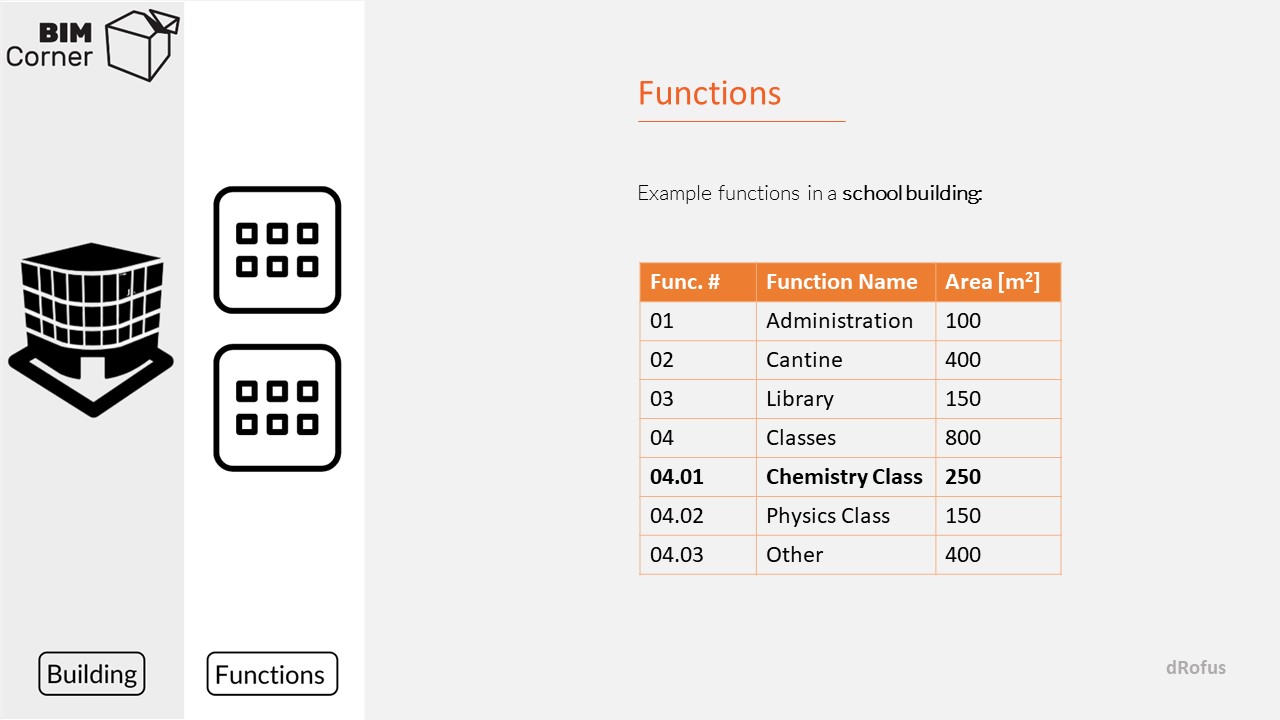
We have here some example functions:
- Administration
- Cantine
- Library
- Classes divided for three sub-departments:
- Chemistry class
- Physics class
- Others
We have all areas assigned to them.
Rooms
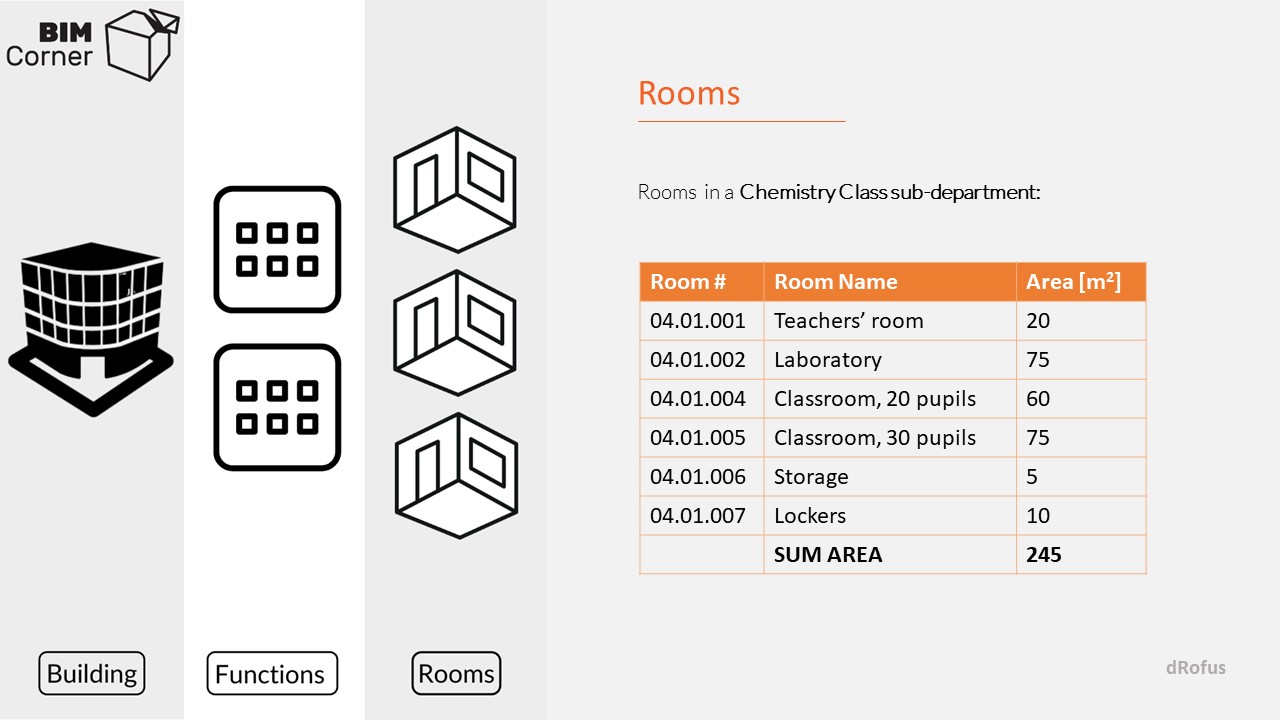
Then we go level below: we have rooms in a chemistry class sub-department.
- Teachers room
- Laboratory
- Two classrooms
- Storage
- Lockers
And all with a sum of programmed area of 245 square meters. And already now we can compare the data for rooms with the data for functions.
Item Lists
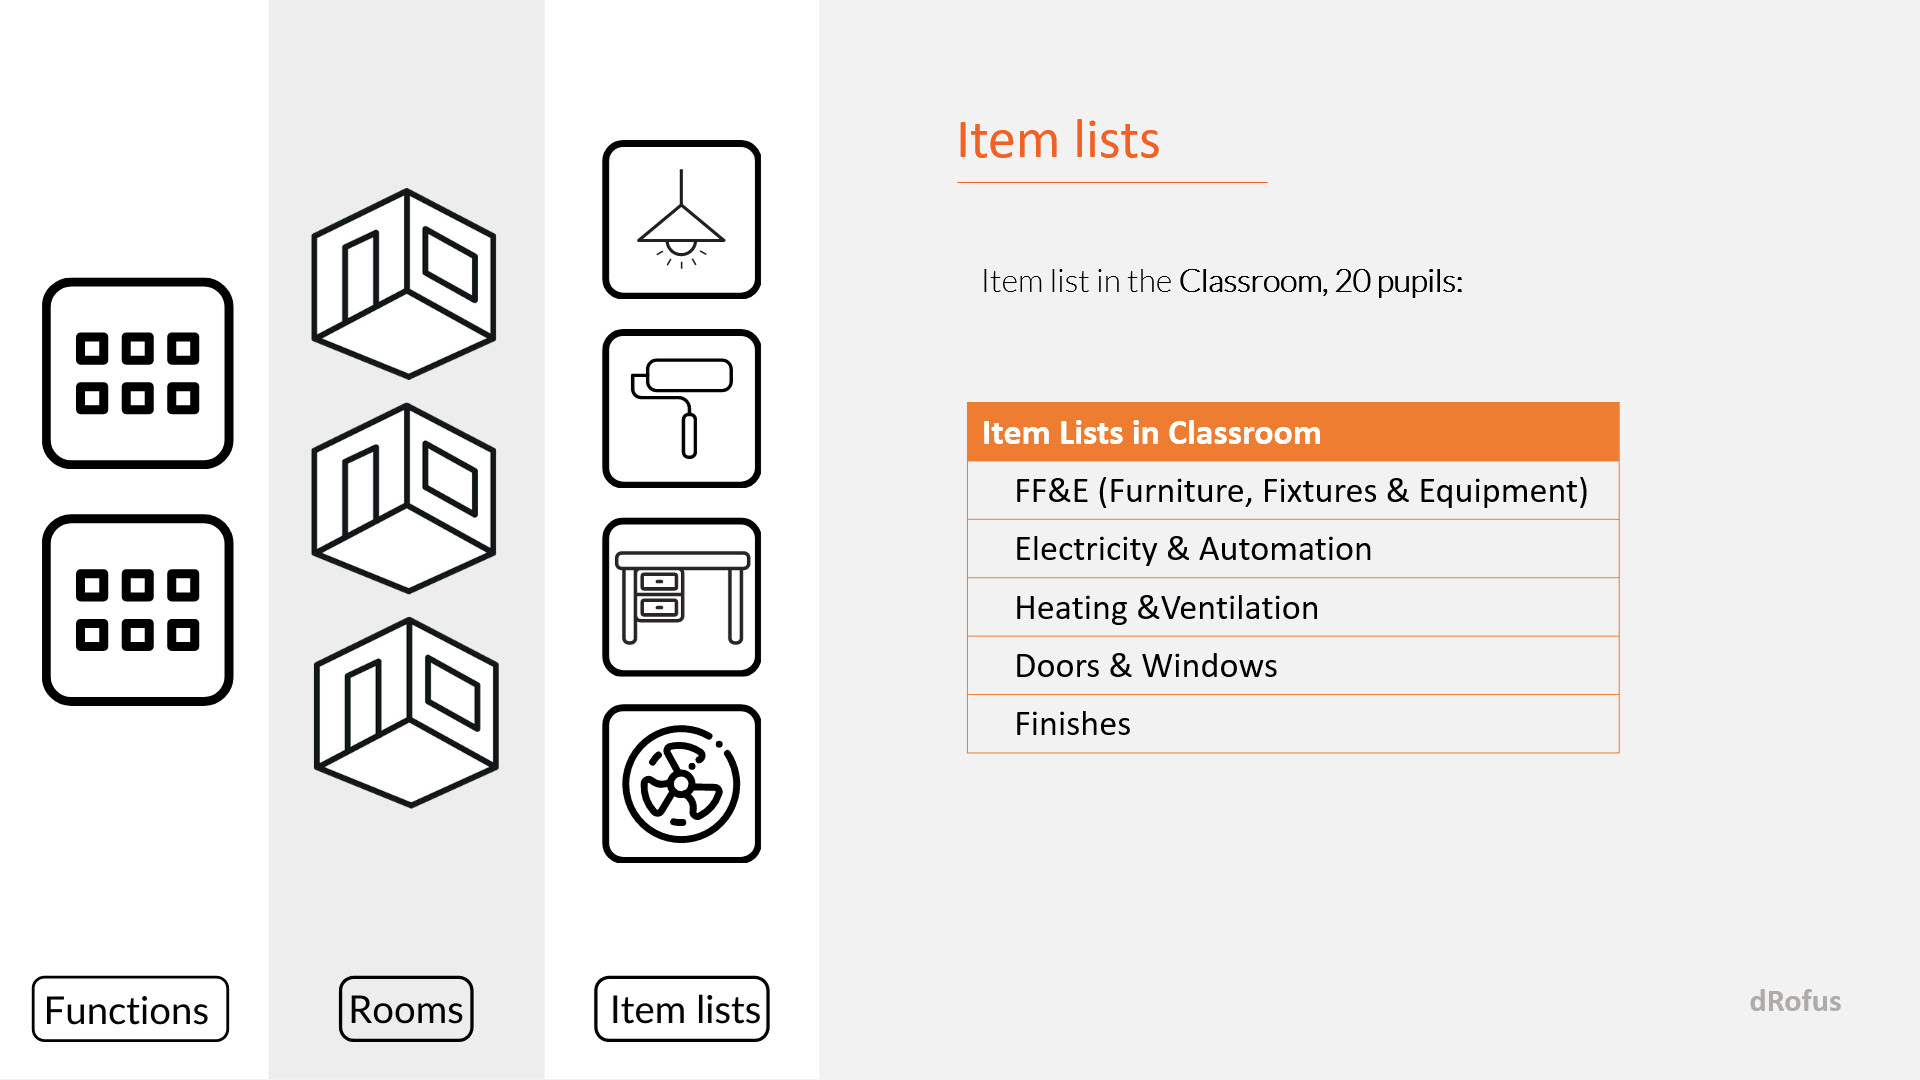
Item list in the classroom for 20 pupils. We’ve got:
- Furniture, Fixtures and Equipment,
- Electricity and Automation,
- Heating and Ventilation,
- Doors and Windows,
- Finishes item lists.
Items
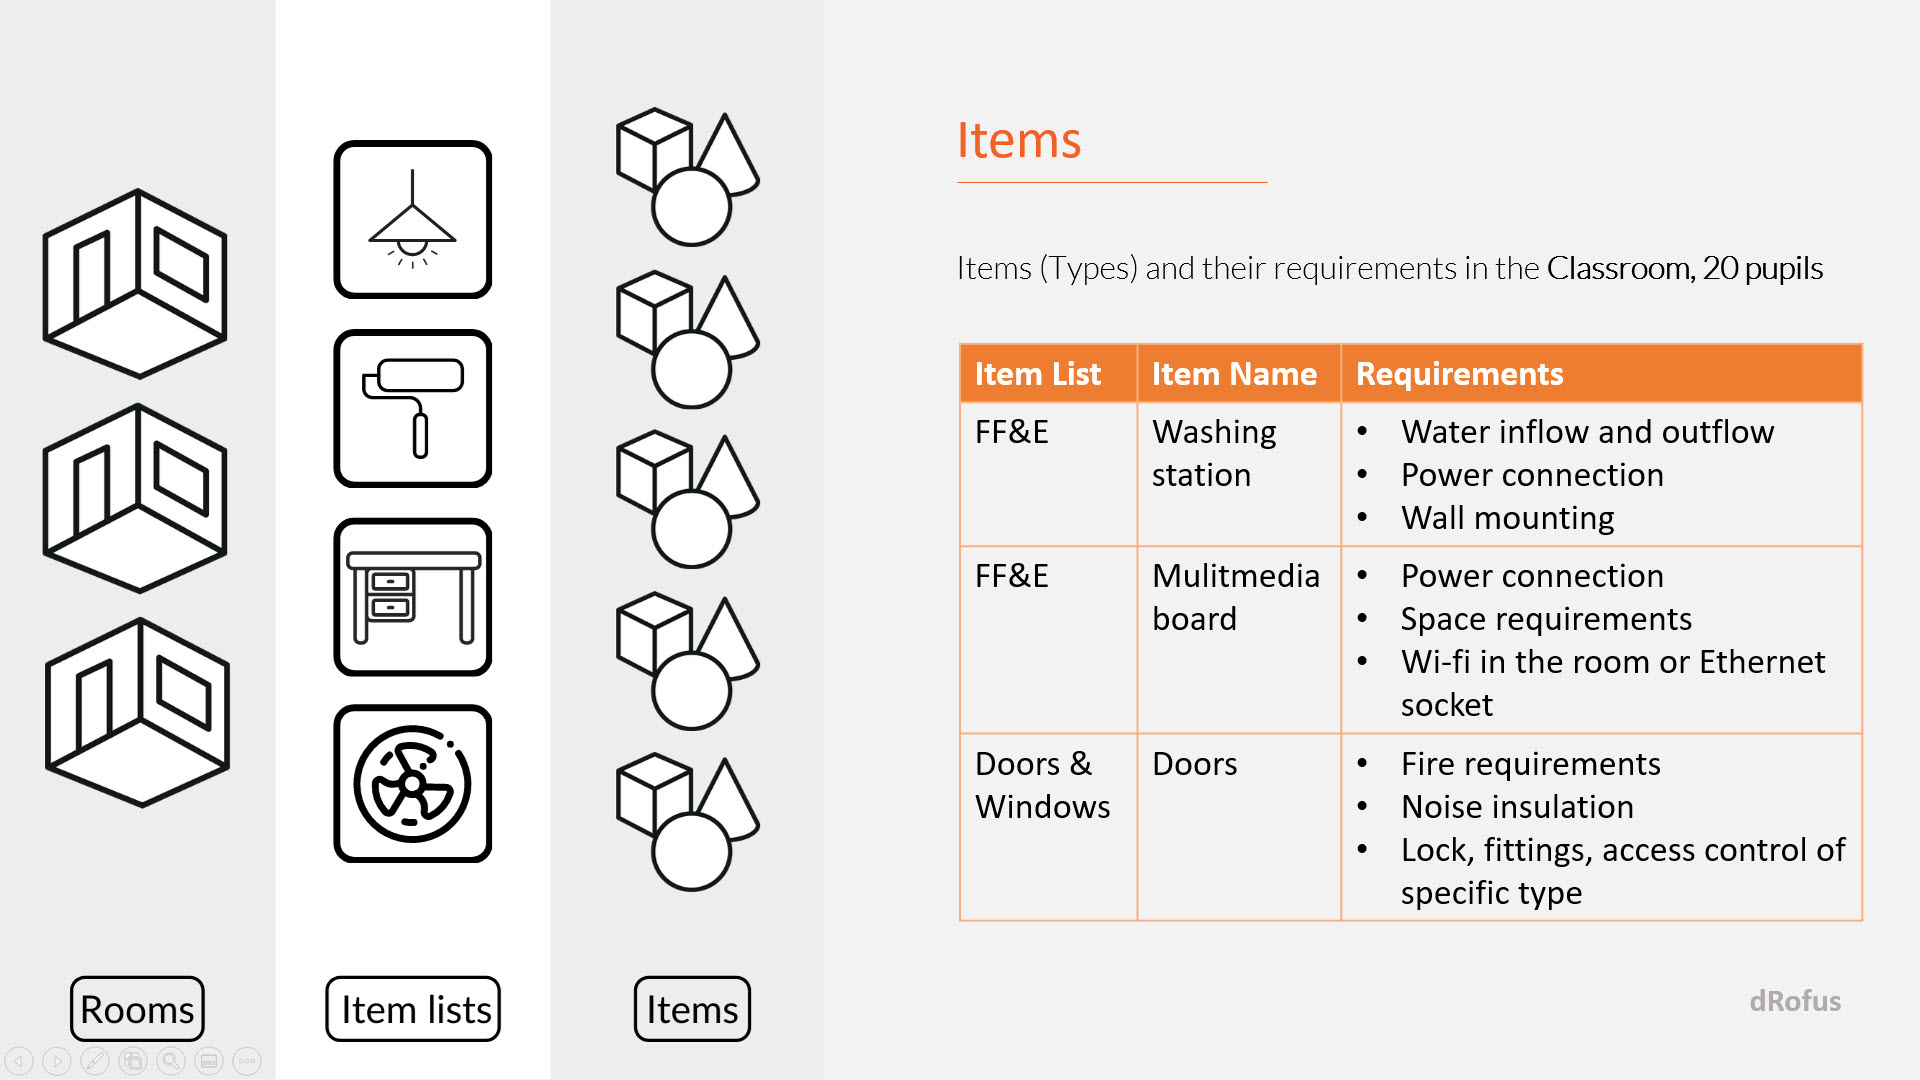
Those corresponds to Revit family types. And their requirements for that particular classroom.
- Washing station,
- Multimedia board,
- Doors have their own requirements. Maybe there are needed some fire requirements like EI30, noise insulation, lock, fittings, access control of a specific type.
Occurrences
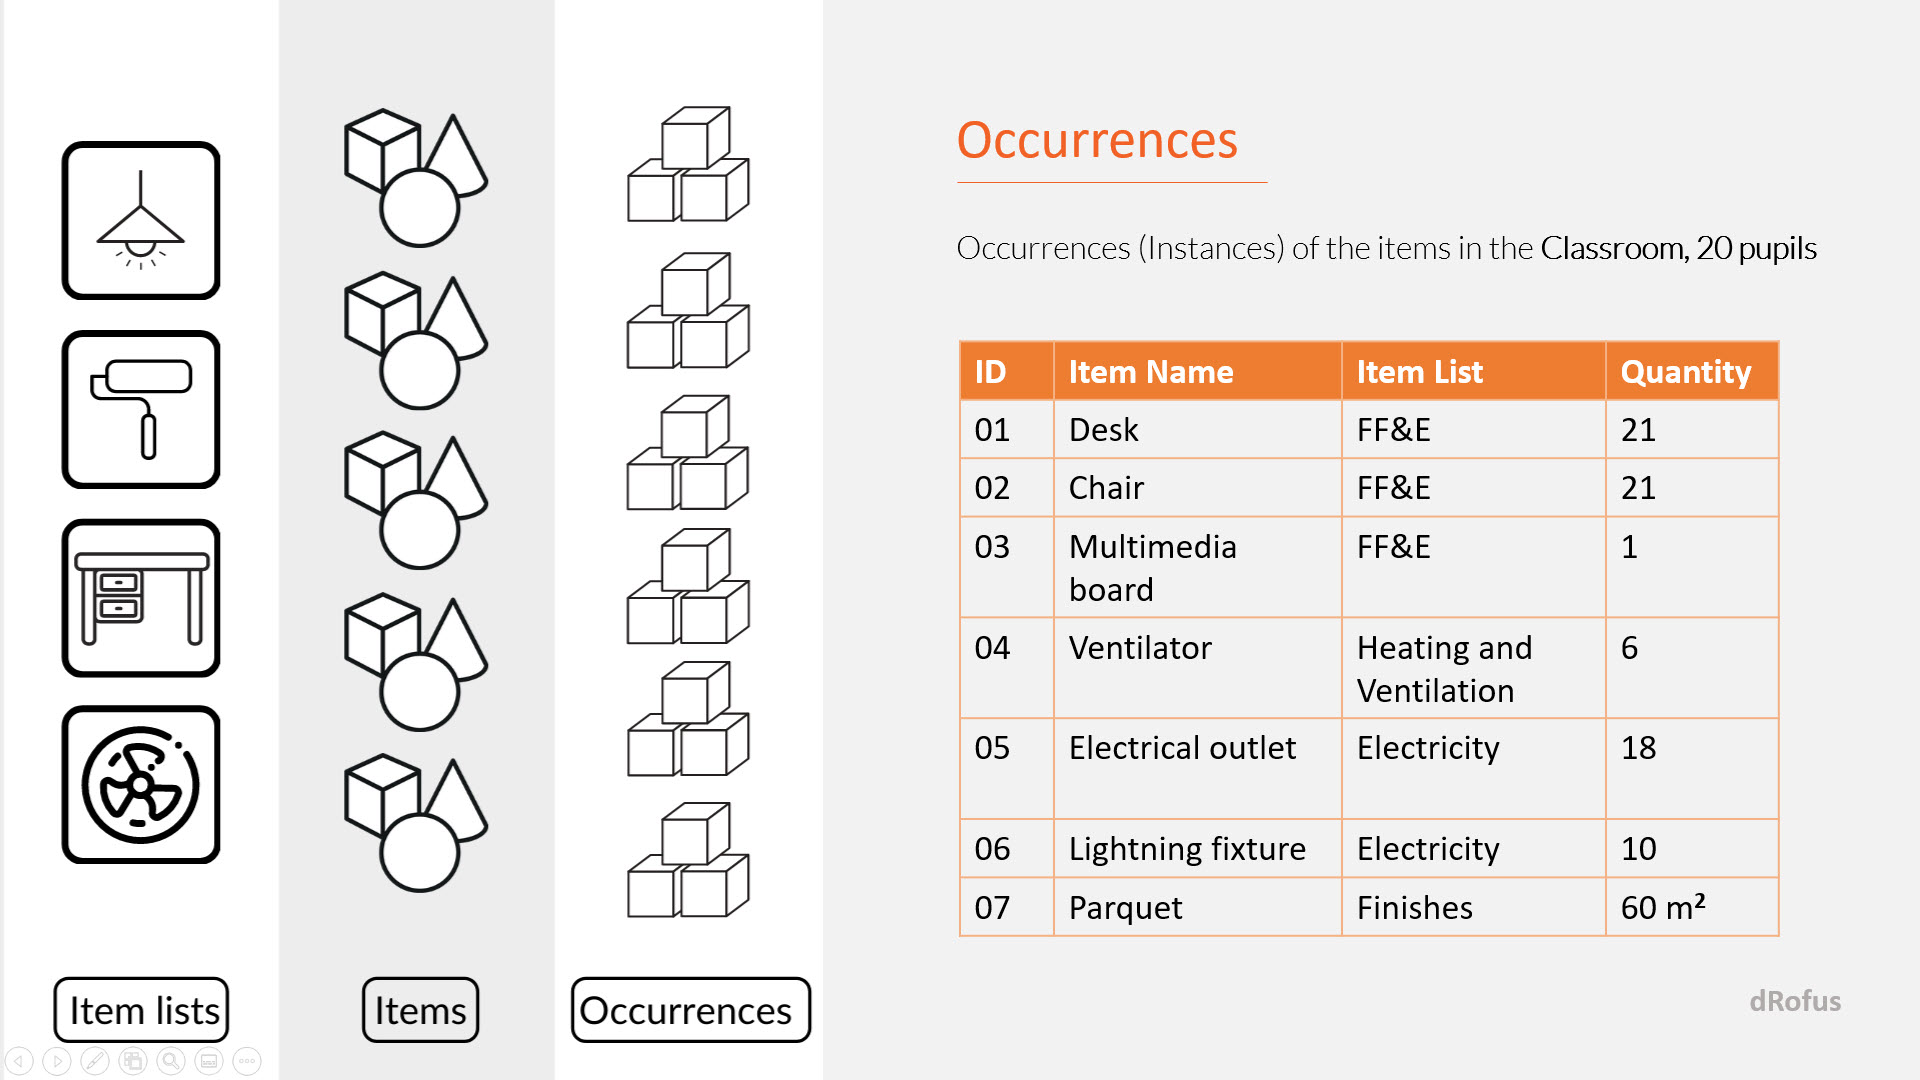
Those are the Revit instances of the items within that classroom. Since this is for 20 pupils, we need 21 desks and chairs. 20 for pupils one for the teacher.
- One multimedia board six ventilators,
- Electrical outlets,
- Lighting fixtures,
- Parquet on the floor.
Products
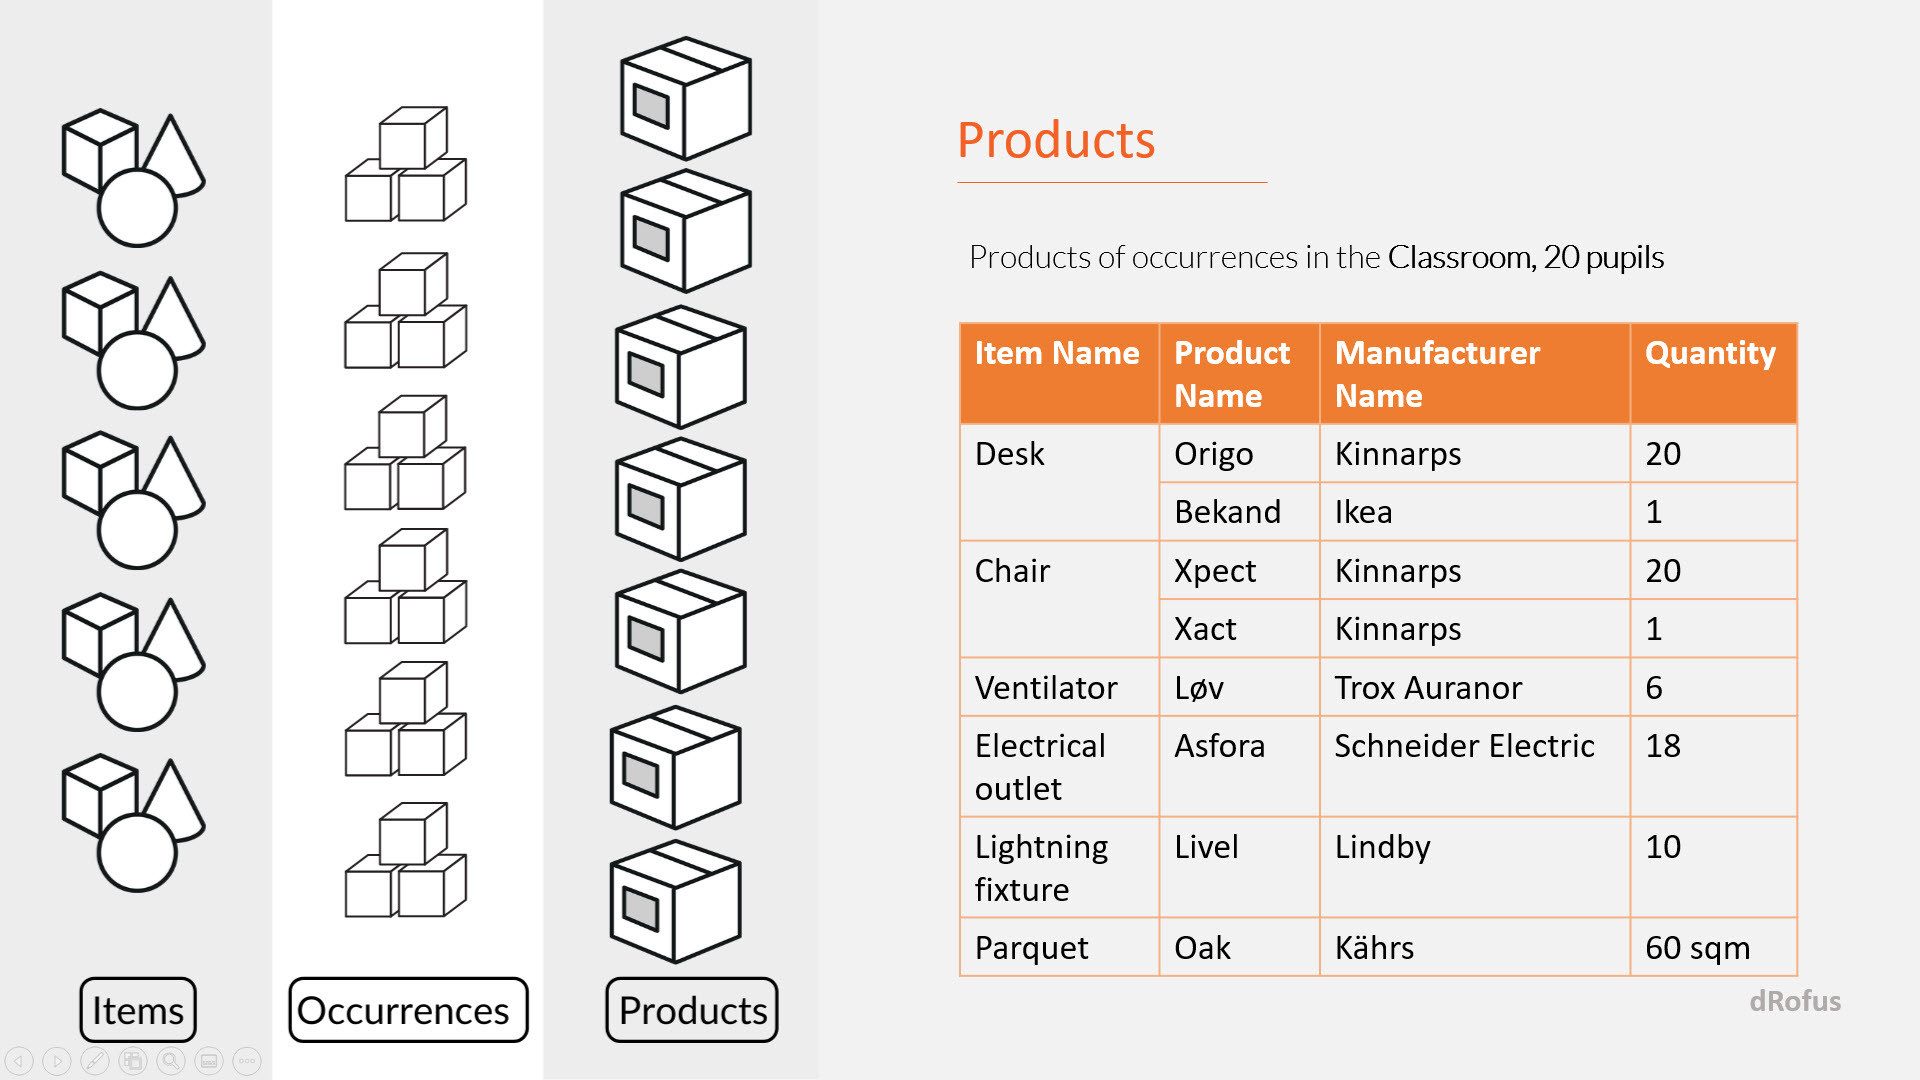
Those are the products that contractors deliver on the construction site place them into the room. We have 20 Origo desks from a manufacturer Kinnarps, one desk for a teacher from Ikea, product name Bekand. Some specific chairs, ventilators, etc. etc.
Those are all products that we can go and buy in the shop. Contractor may deliver them and attach to the database. Maintenance and operation documentation that can be used during the lifecycle of the building.
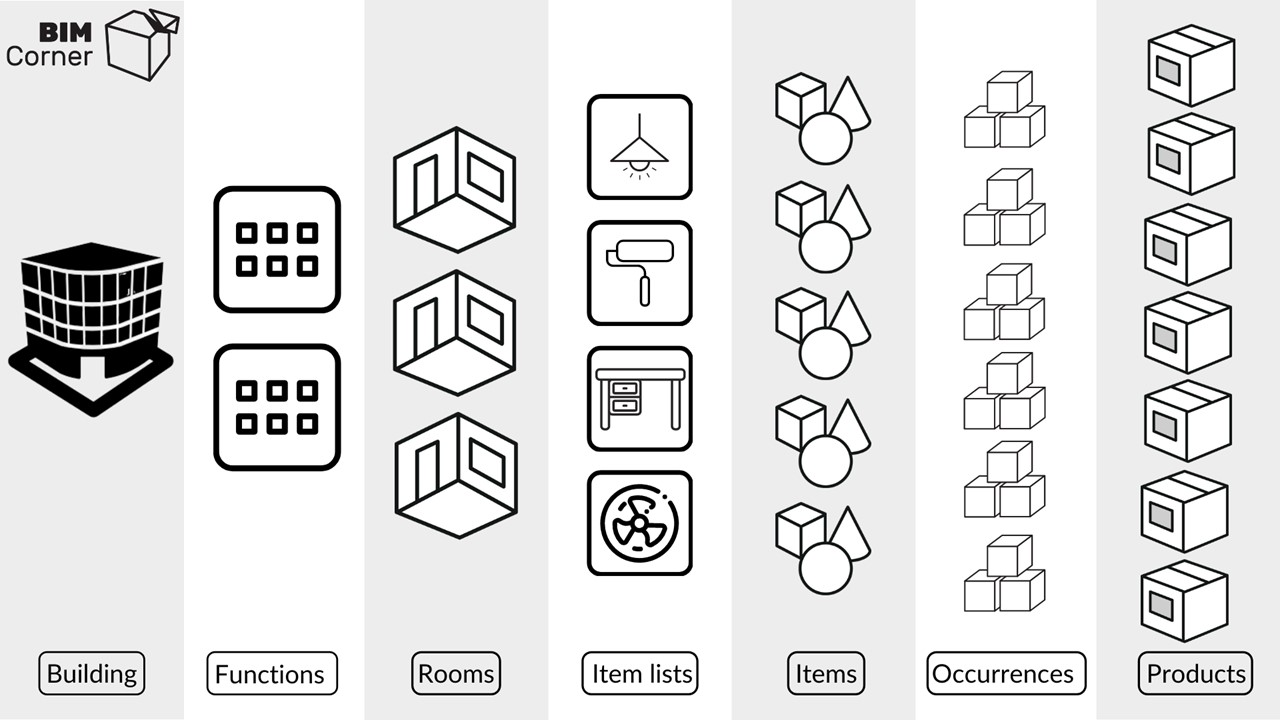
Here it is how it looks in a bit bigger picture so from the left beginning from the very top level we move to smaller and smaller pieces of information. To the more detailed data.
Building Data Structure in dRofus
I’m Dipesh Thapa, I’m Technical Coordinator for dRofus in the Asia-Pacific region and I’m here today to demonstrate how dRofus perfectly fits the bill when it comes to formulating that structured building data hence or slash effectuating its frictionless flow.
First, let’s make a quick recap of the top-down or hierarchical structure identified by Konrad. What I’d now like to do is shrink and then stick the set of graphics to one corner of my screen. There you can see the bottom left just so that it somewhat serves as a legend for navigation if you will.
Building
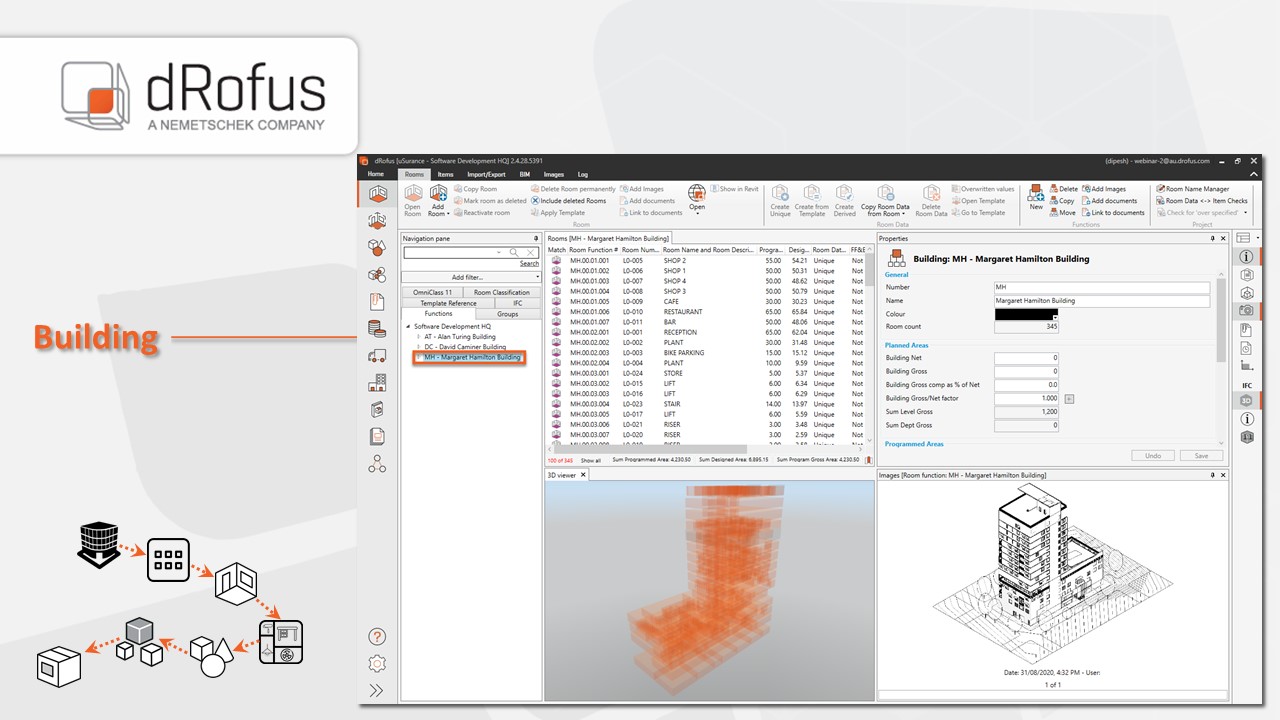
Now that I’ve got dRrofus fired up you will note that I’m using a software development headquarters for an insurance app called uSurance as an example project. First, we’re going to take a look at the highest tier within the building data structure, that is building. You can see here that we happen to have three buildings for the project.
Function
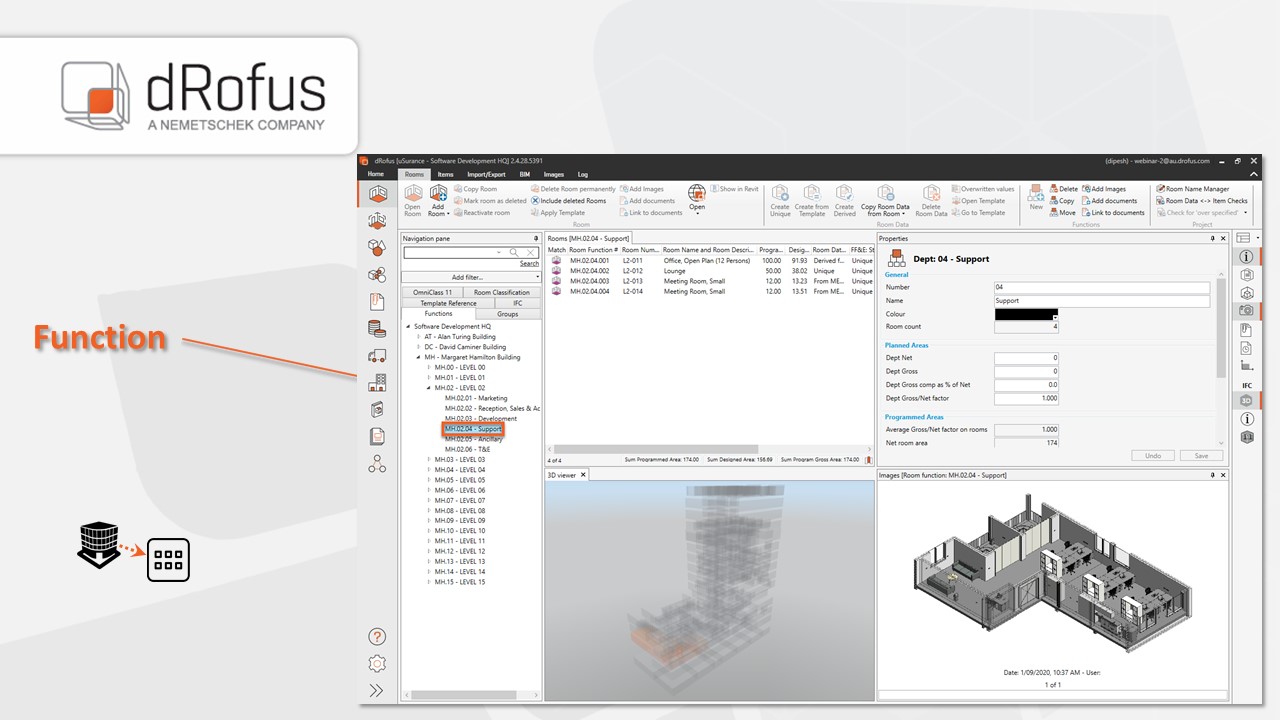
Let’s pick a building say the Margaret Hamilton building. We’re now going to step down to the second-highest tier within the building data structure, that is function. You can see here that we happen to have a few functions within the Margaret Hamilton building. At this stage, I’d like to point out that functions can be customized to be whatever you like. They could be zones, departments, sub-departments, etc. In this example, you can see that I’ve set up as levels in departments. Let’s pick a function. When we select level two as an example under level two we’re going to choose the support department.
Room
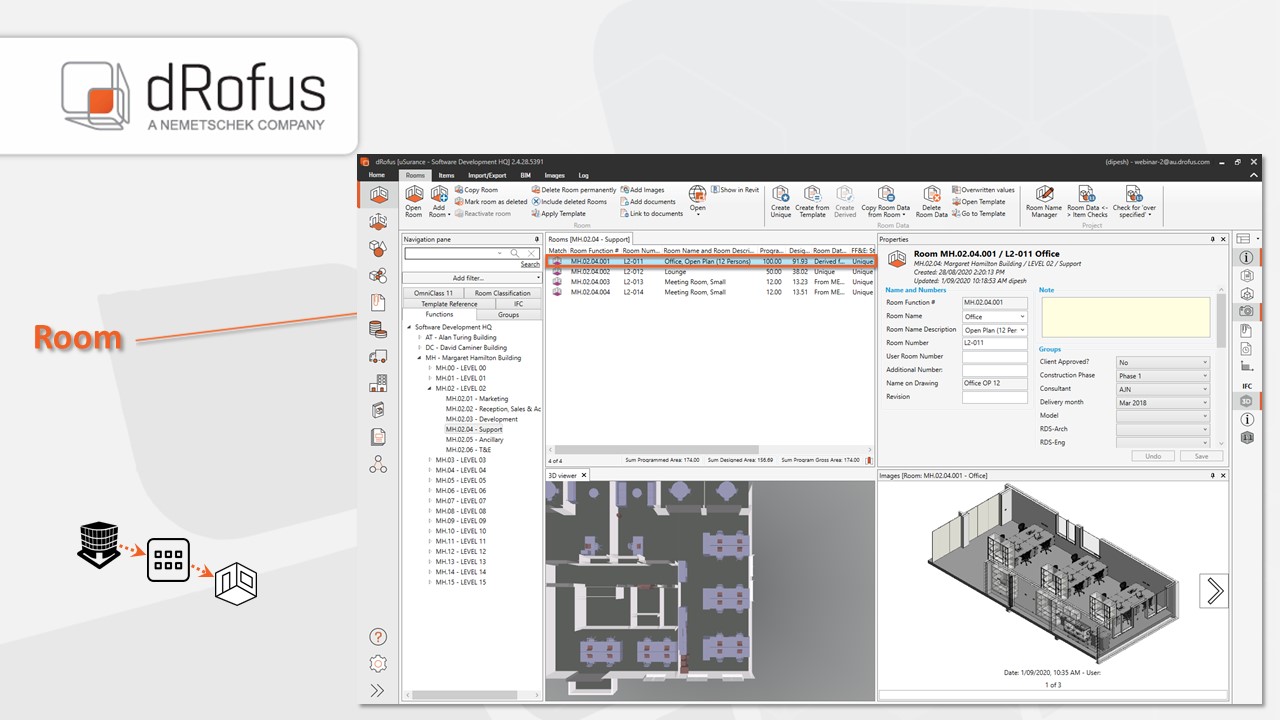
We’re now going to step further down to the next tier within the building data structure that is room. You can see here that we happen to have four rooms within the function support department at function level. Let’s pick a room say the 12 person open-plan office.
Item lists

We’re now going to look at the next tier within the building data structure, that is the item list. We have five item lists set up in this example project. Namely FF&E, Doors and Windows, Finishes, Services and Packages.
Item
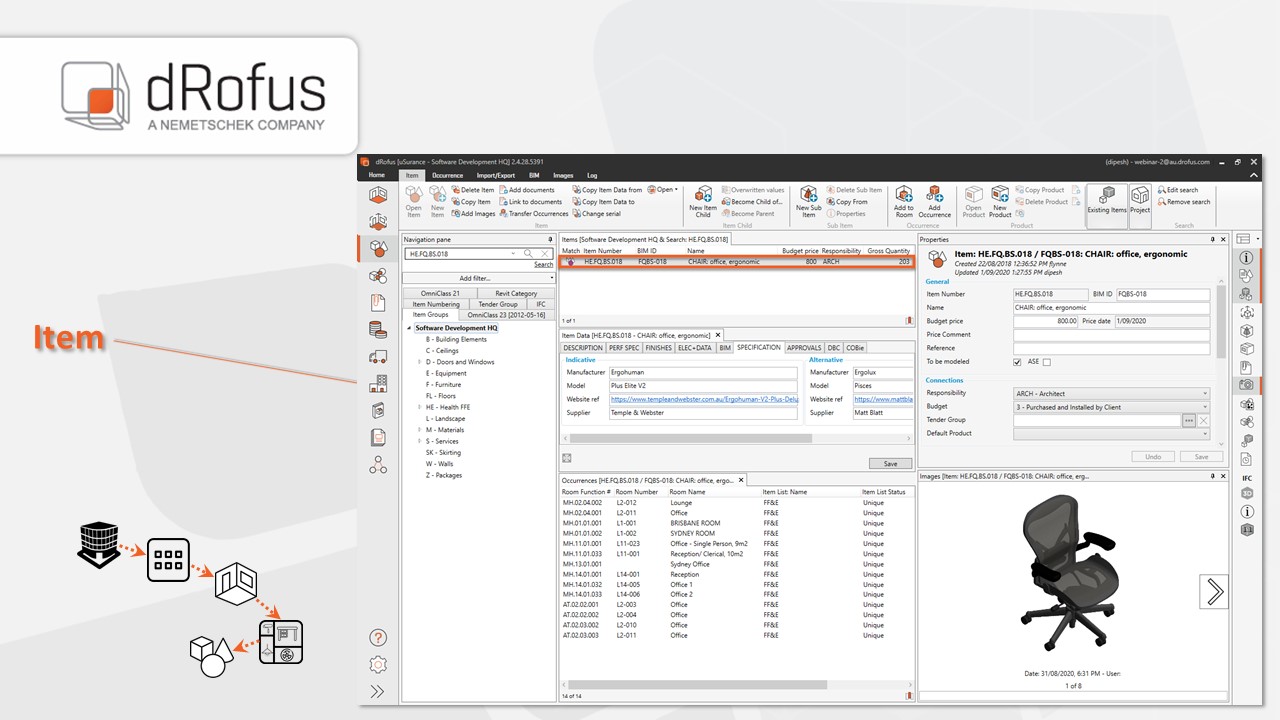
Let’s pick an item list let’s say the FF&E item list. Let’s step further down to the next tier within the building data structure that is item. You can see here that we happen to have a variety of items within the FF&E Item List of this particular office. Let’s pick an item, say the Ergonomic office chair.
Occurrence
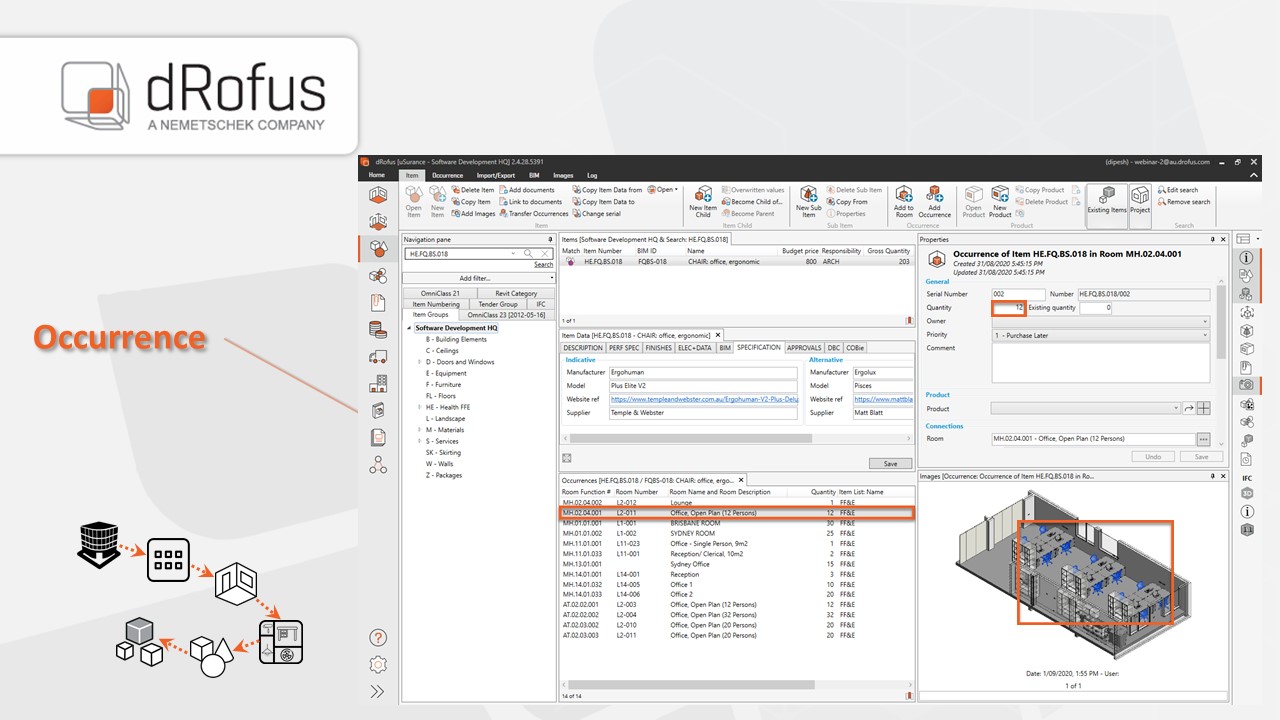
Let’s step further now to the next tier which is the occurrence. You can see here that we happen to have a number of occurrences for this ergonomic office chair across a number of rooms within this project. If we now pick the very occurrence of this ergonomic office chair specifically in the 12 persons’ office. Which we are looking at earlier, you will note that there were 12 instances of that chair in that particular room.
Products
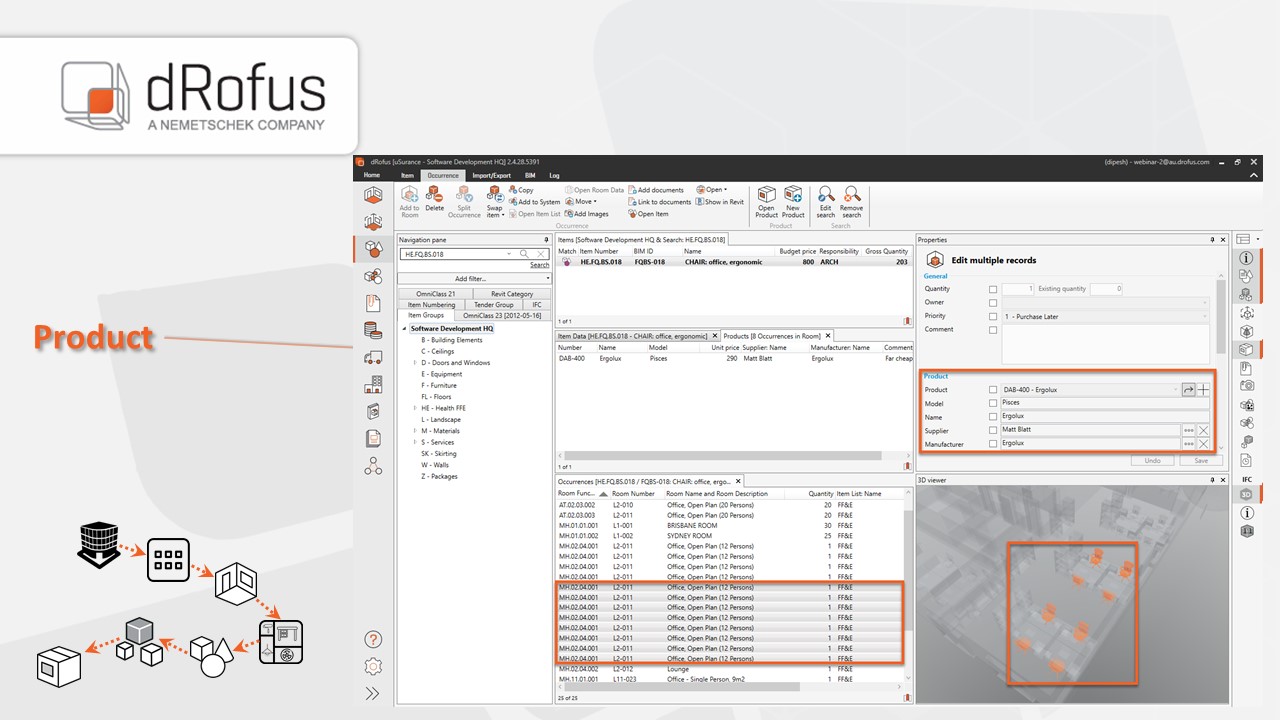
The final tier within the building data structure that we’re going to step down to is product. You can see here that we happen to have two products as options for this ergonomic chair. If we now select each product, you can subsequently see all the associated information. Let’s say, we’d like to take a closer look at the occurrences of the ergonomic chair, specifically in the 12 persons open-plan office. Products are typically based on occurrences.
Conclusion
The journey, which I’ve just taken you through, has been from the project to a specific building, to a specific function, to a specific room, to a specific item list, to a specific item, to a specific occurrence and finally to a specific product, has been one of almost a “Choose your own adventure” type of scenario.
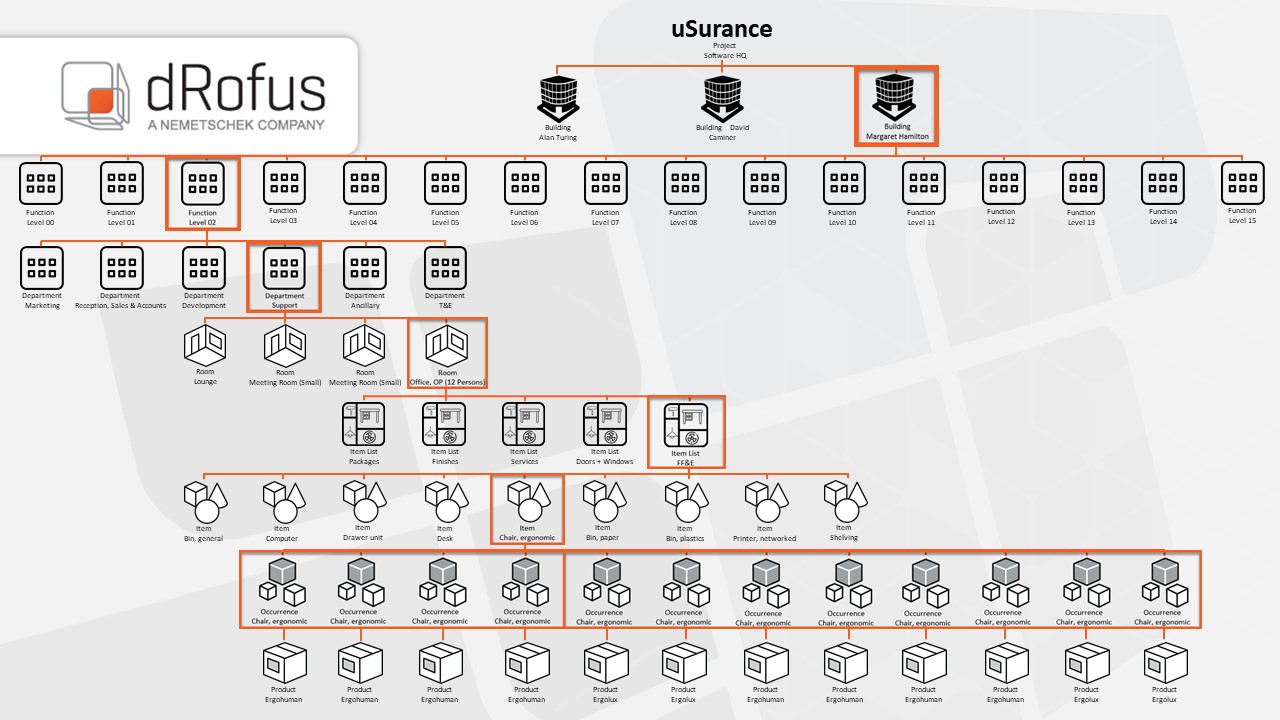
In other words, this is the very path we have just taken. And yes, it does somewhat look like a pretty big family tree. So what this tells you right away is that dRofus is perfectly capable of handling an infinite amount of building data. And that too, at various specific tiers all the while maintaining the most complex data relationships across the multiple generations.
As a conclusion the advantages of structuring building data in a database it’s:
- Easy data aggregation and scheduling,
- Ease of management of the vast number of information
- Data is placed in the interconnected tables,
- Seamless navigation from a general to a detailed perspective or the other way around